


The resource buildout of the western grid used to support the baseline conditions pricing and analyses more broadly, establishes many of the common assumptions that are used throughout the scenario work and was developed to be a point of comparison for that work.
The baseline buildout simulations went through many iterations and were performed over many months (June 2020 through November 2020) in response to significant feedback from the System Analysis Advisory Committee and the Council. The reason for this extended timeline was that initial buildouts were not meeting policies, not adequate and building more gas plants than stakeholders thought reasonable. Significant modifications to default[1] model assumptions and configuration were made throughout the process including the following: limiting gas plant builds in many parts of the WECC, developing a renewable energy credit price forecast based on the shadow price of meeting policy requirements, creating smoother trajectories for policy requirements, using top 120 peak hours to determine resource capacity contributions, and ramping in planning reserve margins for operating pools to smooth early study build rates.
Baseline Buildout - Westwide
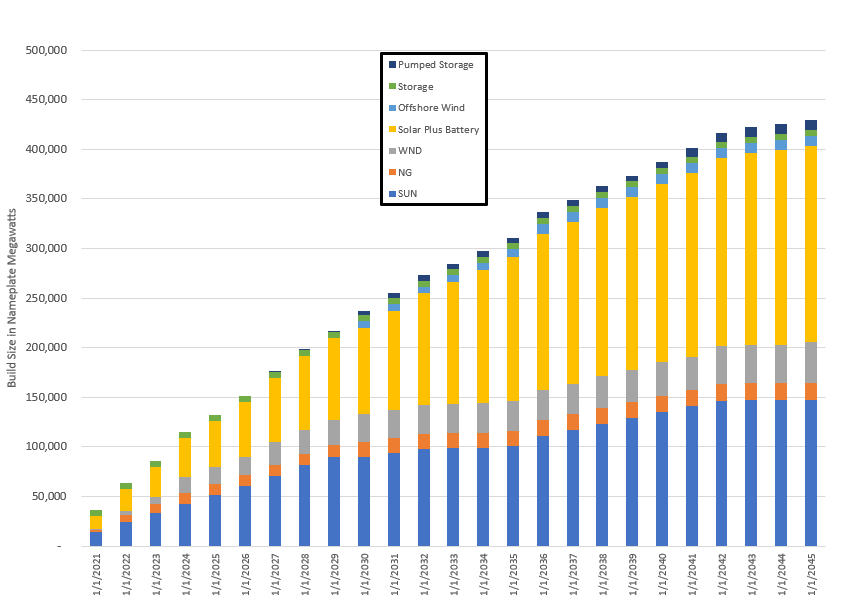
The buildout in the baseline conditions by included over 401 gigawatts of nameplate build by 2041 as seen in the figure above. Over 81% of the new resource buildout was either stand-alone solar or solar plus battery hybrid resources, and almost 92% of the buildout was solar or wind. A significant amount of the renewable buildout appears to be to meet the policies enacted by states or municipal governments, and/or goals by utilities. Limitations on gas plant builds [2] further increased renewable and storage resource builds.
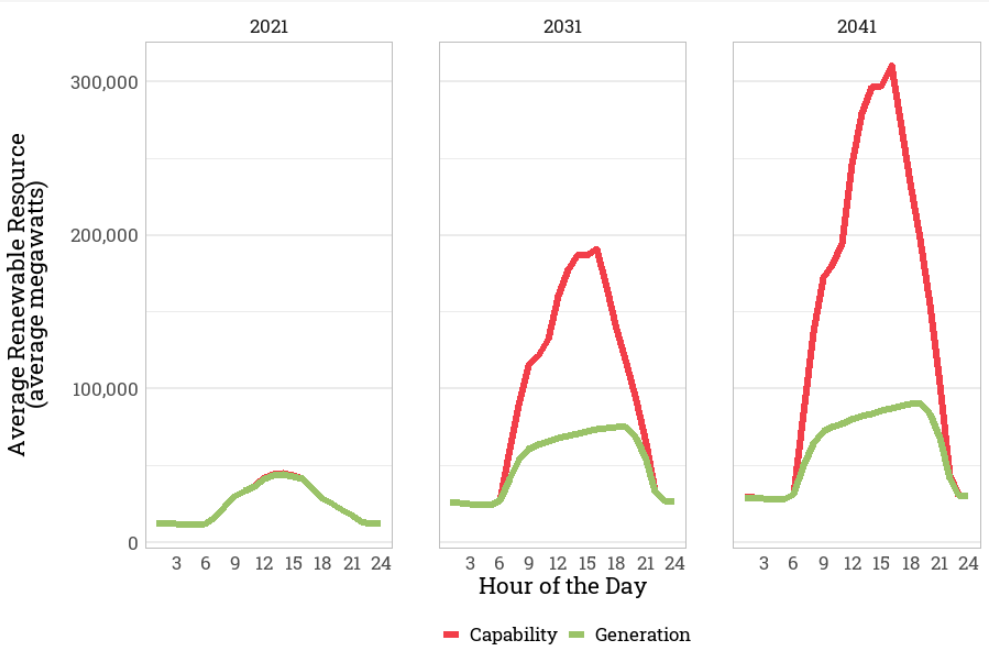
As a result of the large amount of renewable generation built, renewable curtailment[3] became significantly more prevalent throughout time, especially during midday hours. In 2021, as can be seen in the graph below, the maximum renewable curtailment in any hour of the day averaged under 600 megawatts and by 2041 grew to 220,000 megawatts.
Renewable Curtailment
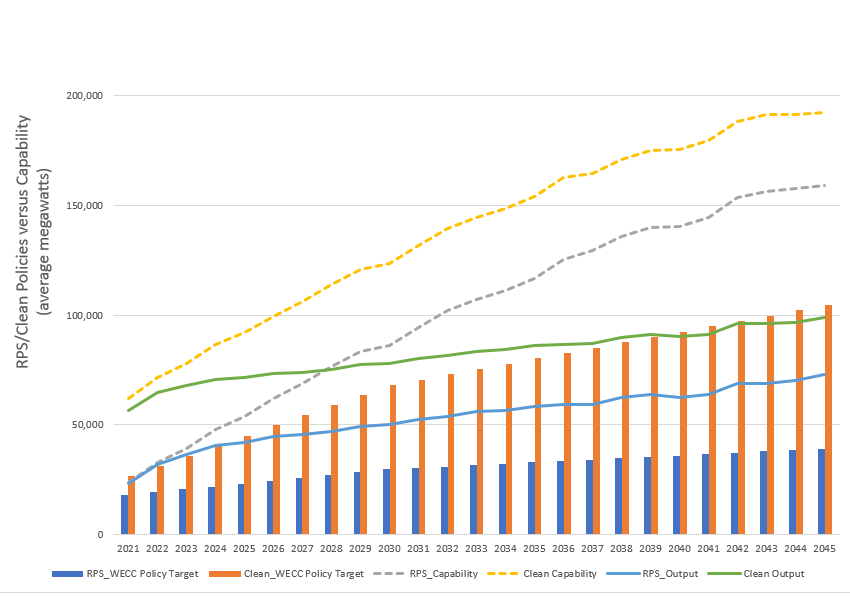
This extensive renewable curtailment made it challenging to enforce compliance with some of the clean policies and goals with the current technologies as can be seen in the graph below. By 2040, with current system operations,[4] transmission infrastructure and the assumed buildout the system is forecasted to not be able to meet all of obligations implied by the clean policies and goals[5] even though the buildouts contain sufficient capability to generate that much power. The state renewable portfolio standards are met for all years of the study.
Clean Policy Versus Capability Baseline
The following spreadsheet contains further supporting information on the baseline conditions buildout:
[1] Default modeling assumptions are per the configuration of AURORA as delivered as a product. All changes to these can be seen via change sets associated with the project file and are available upon request to those with an AURORA license.
[2] Initial studies showed upwards of 70 nameplate gigawatts of gas, but advisory committee and Council feedback made it clear that was much higher than the expected gas plant build. Thus, for the baseline gas plant build was limited, but the removal of those limits was tested in the No Gas Build Limits sensitivity.
[3] Renewable power is often limited by how much “fuel”, insolation and wind, is available at any given time. Sometimes, more power is generated than is needed, or can be sunk to the grid due to transmission, demand or operational constraints on other generators. In this case, the power is “curtailed” or “spilled.”
[4] It is possible that revised system operations or different policy structure might reduce renewable curtailment, but the current market structure is devised to reduce production cost not to eliminate emissions.
[5] Missing the obligation is from a physical compliance inside the WECC perspective, there may be alternative compliance methods.