After developing the forecast for regional natural gas hub prices, the next step is to develop a forecast of delivered prices for the regional natural gas plants. These prices provide the input for natural gas in the Regional Portfolio Model (RPM). Forecasted delivered prices represent what regional power plants are expected to see while purchasing natural gas fuel (MMBtu) to generate electricity (MWh) over the next 20 years. These prices are important for long-term power planning. Fuel purchases compose a significant portion of the overall cost to run a natural gas power plant and; and cost considerations are key in making planning decisions.
A new tool was developed for this power plan to model the price of gas delivered to the power plant. The model develops the historic relationships between the fuel costs that regional gas power plants incur, gas prices at regional natural gas hubs, and the pipeline transportation charges required to deliver the purchased gas to the plant.
Here’s the flow:
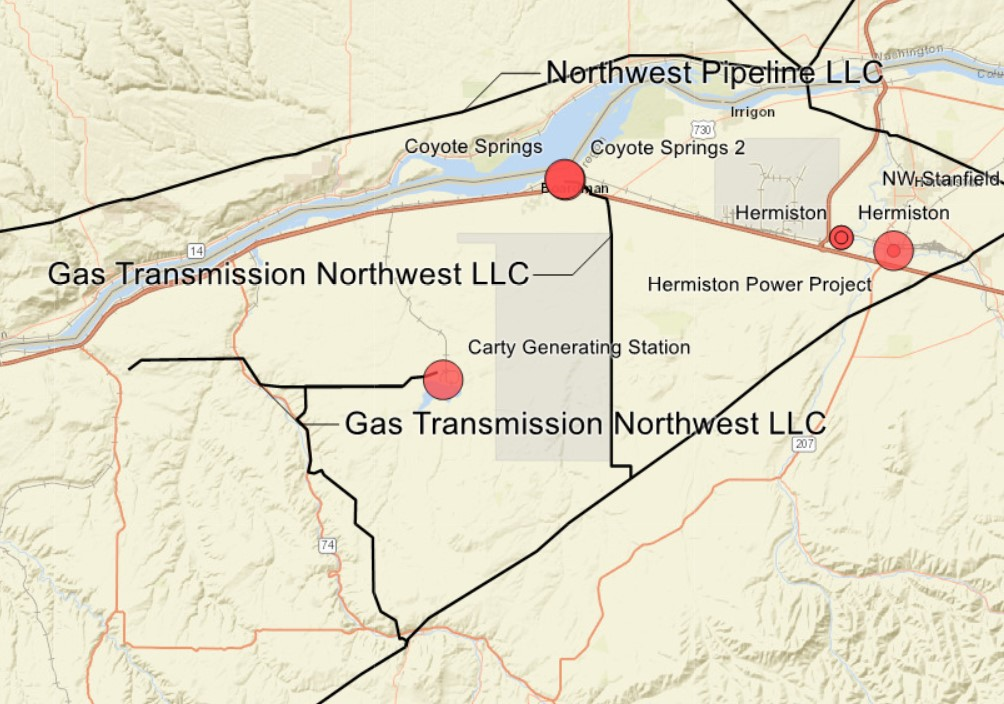
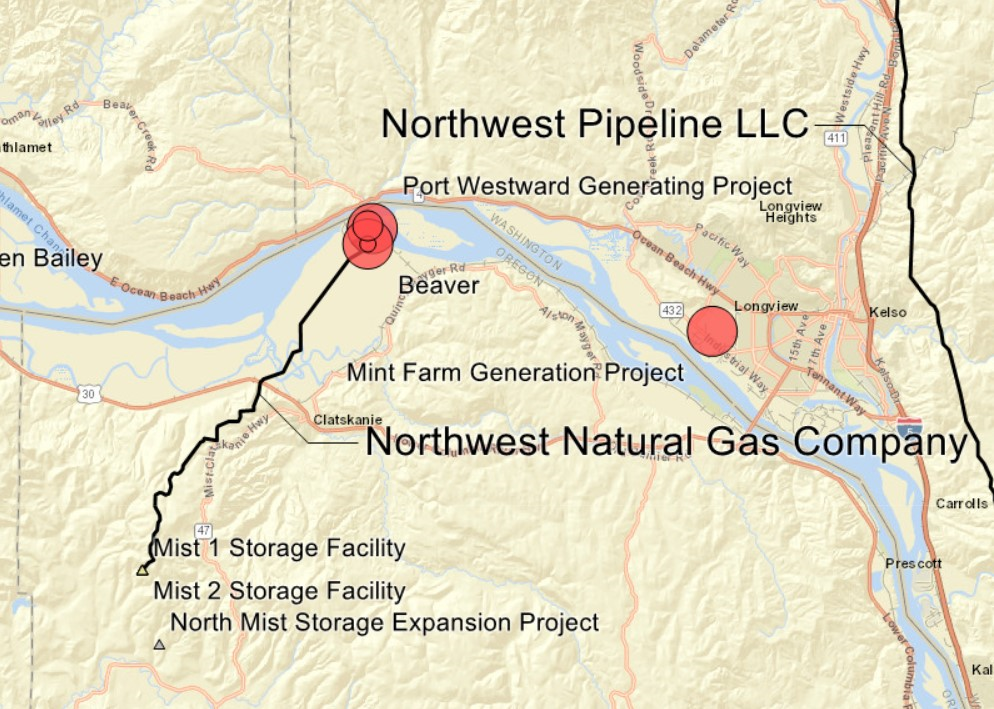
- Specific regional power plants were identified from the states of Idaho, Oregon and Washington and individually modeled. An even mix of plants from the East side and West side were selected.
- For each plant
- Data on fuel costs and quantities were collected from each plant on a monthly basis, as reported to EIA. By dividing this cost ($) by the amount of gas (MMBtu) purchased to generate electricity, a monthly historic delivered price ($/MMBtu) was calculated.
- the most likely pricing hubs (or hub) the plant would have based fuel purchases on were identified and collected
- the specific pipeline that the plant would draw most of their gas from was identified and that pipeline’s transportation delivery charge was collected
A model was then fit for each plant to replicate the monthly fuel cost:
Dm = function(tp, hi,m)
where
Dm: delivered fuel price $/MMBtu in month “m”
tp: pipeline transportation charge $/MMBtu
hi,m: gas price at hub “i” and month “m” $/MMBtu
The model produces historic time series for the delivered fuel price ($/MMBtu) for each plant. A forecast for RPM can then be developed using forecast hub prices and calculating a capacity weighted value for delivered prices on the East and West side.
Input Data & Sources
| Power Plant Purchased Fuel Cost | Pipeline Transportation Charges | Gas Hub Prices (from gas hub history) |
| EIA-923 and -860 reports | Williams Northwest Pipeline tariff | Sumas |
| Page 1 generation and fuel data | TransCanada NOVA Gas Transmission Ltd. (NGTL) | AECO |
| Page 4 generator data | TransCanada GTN | Opal |
| Page 5 fuel receipts and costs | Stanfield |
Gas Power Plant and Pipeline Map Example West Side
Gas Power Plant and Pipeline Map Example East Side