


The resource buildout of the western grid used to support the WECC-wide emission price scenario pricing and analyses incorporates many of the common assumptions that are used throughout the scenario work, but also applies the Social Cost of Carbon to the dispatch cost of all plants with carbon emissions in the western grid. This carbon cost overrides emissions pricing assumptions in the baseline.
The associated buildout is similar to the baseline but due to the explicit pricing on emissions, this study builds more zero or lower emissions resources earlier to displace higher emitting existing resources than in the baseline buildout.
WECC-wide Emissions Price buildout
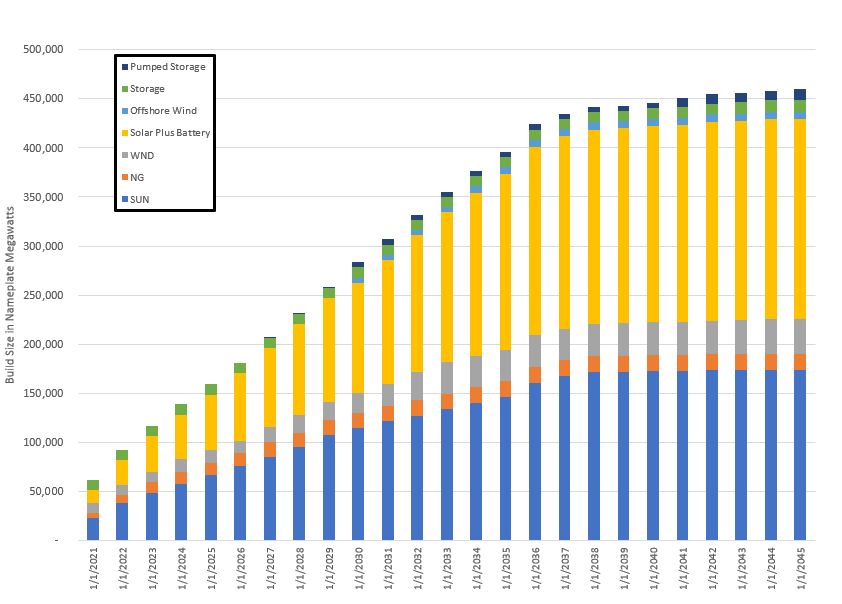
The buildout in the WECC-wide emissions pricing study included over 450 gigawatts of nameplate build by 2041 as seen in the figure above. Nearly 83% of the new resource buildout was either stand-alone solar or solar plus battery hybrid resources, and over 92% of the buildout was solar or wind. Like in the baseline significant amount of the renewable buildout appears to be to meet the policies enacted by states or municipal governments, and/or goals by utilities and limitations on gas plant builds [1] further increased renewable and storage resource builds. There were not enough renewables to meet clean policy requirements within the current operations and transmission without adding an emerging technology[2] by 2030 that is referred to as a proxy clean resource.
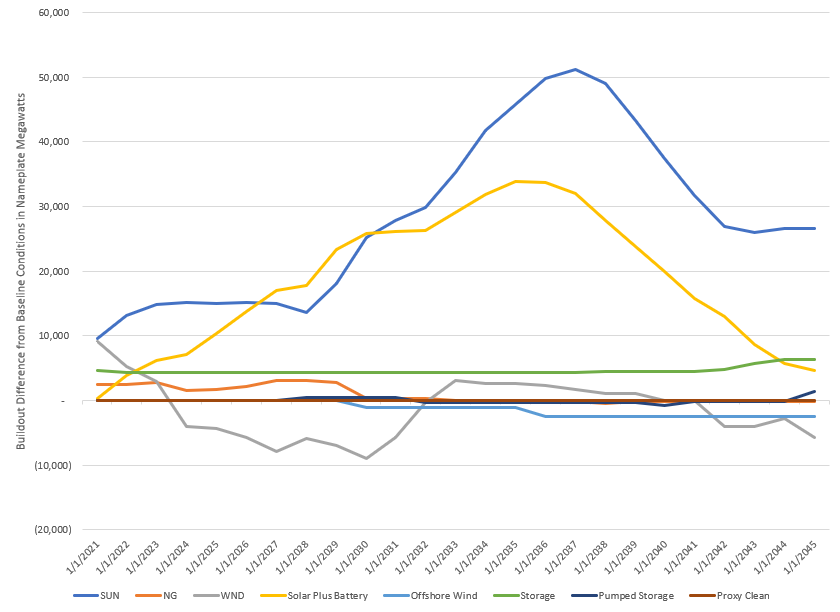
As can be seen below, significantly more solar resources are built in general than in the baseline. Additionally, the new gas build is accelerated in comparison to the baseline. Increased generation sourced from these resources displaces existing coal and inefficient gas plant dispatch which are penalized the most heavily by the emissions pricing.
Build Comparison to Baseline
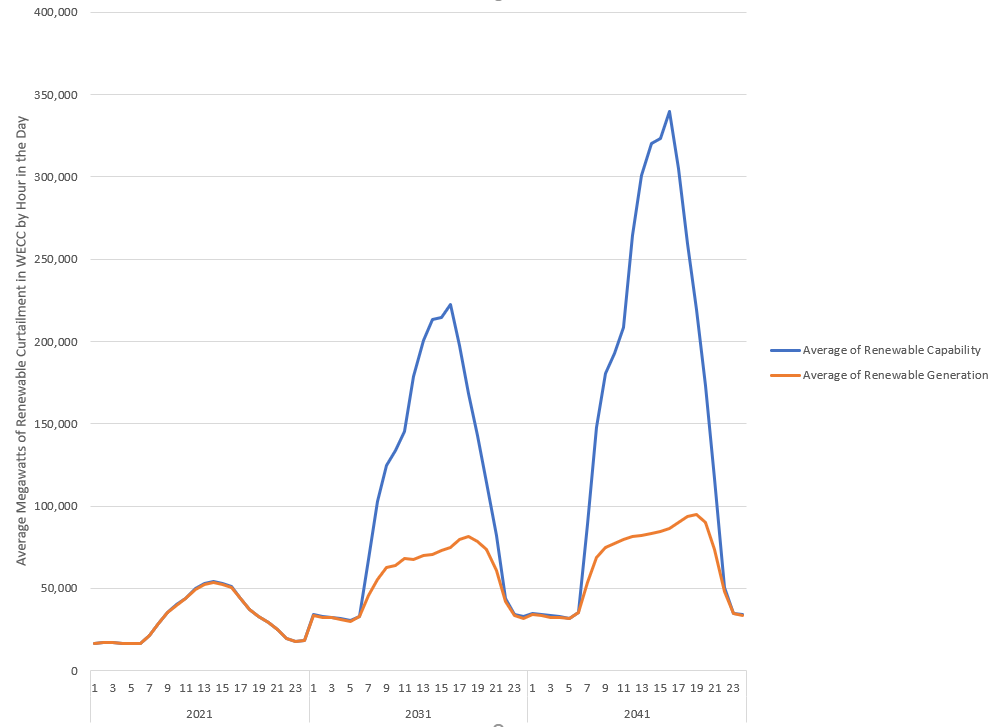
Also like the baseline results a large amount of renewable generation is built, causing renewable curtailment[3] to become significantly more prevalent throughout time, especially during midday hours. In 2021, as can be seen in the graph below, the maximum renewable generation curtailment in any hour of the day averaged under 480 megawatts and by 2041 grew to over 253,000 megawatts. This is less renewable curtailment in the early years and more renewable curtailment later years in the WECC-wide emissions cost study than in the baseline.
Renewable Curtailment
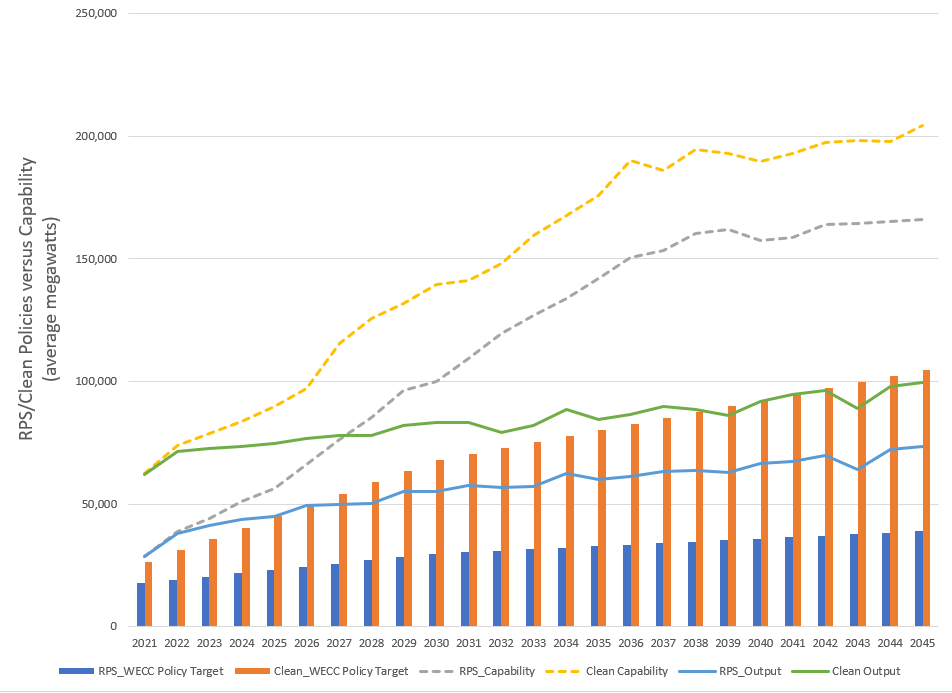
This extensive renewable curtailment made it challenging to enforce compliance with some of the clean policies and goals with the current technologies as can be seen in the graph below. By 2039[4], with current system operations,[5] transmission infrastructure and the assumed buildout the system is forecasted to not be able to meet all of obligations implied by the clean policies and goals[6] even though the buildouts contain sufficient capability to generate that much power. The state renewable portfolio standards are met for all years of the study.
Clean Policy Versus Capability Baseline
The following spreadsheets contain further supporting information on the WECC-wide emissions price scenario buildout:
Buildout Information for WECC-wide Emissions Price Scenario
Buildout Comparison to Baseline Conditions
Renewable Curtailment in WECC-wide Emissions Price Scenario
[1] Initial studies showed upwards of 70 nameplate gigawatts of gas, but advisory committee and Council feedback made it clear that was much higher than the expected gas plant build. Thus, for the baseline gas plant build was limited, but the removal of those limits was tested in the No Gas Build Limits sensitivity.
[2] This proxy clean resource characteristics used to represent an example of something from the emerging technology clean resource stack in the studies were the attributes and estimated costs associated with a small modular nuclear reactor.
[3] Renewable power is often limited by how much “fuel”, insolation and wind, is available at any given time. Sometimes, more power is generated than is needed, or can be sunk to the grid due to transmission, demand or operational constraints on other generators. In this case, the power is “curtailed” or “spilled.”
[4] Technically, the policies are missed in 2035 but since many of the policies are based on multiple year averages of generation for compliance the narrative reports the first year after which the policies are missed persistently.
[5] It is possible that revised system operations or different policy structure might reduce renewable curtailment, but the current market structure is devised to reduce production cost not to eliminate emissions.
[6] From a physical compliance inside the WECC perspective, there may be alternative compliance methods.