Existing and new/proposed power plants
Charts below are based on the Council’s generating resources project database (see Excel, April 2024) of projects under construction, permitted sites, proposals, recently-completed projects and recent retirements. Email corrections/updates to Annika Roberts.
Capacity is essentially the 'horsepower' rating of power plants, or how much they are designed to produce at full load operation. Download chart as PNG * Other includes geothermal, petroleum, and solar
Capability is the maximum amount of energy the plants are capable
of producing over the course of an average year. Download chart as PNG
* Other (yellow segment) includes geothermal, petroleum, and solar
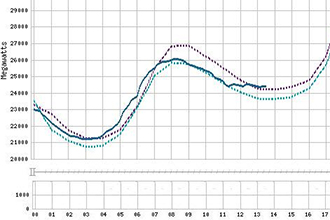
Total energy produced each year. Download chart as PNG
Data from EIA. Region includes WA, OR, ID, and MT, plus Jim Bridger (WY) and half of North Valmy (NV). Download chart as PNG
Energy brought online or retired each year (new plant construction, etc.). Download chart as PNG
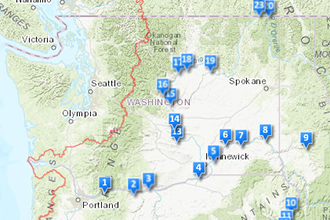
Maps
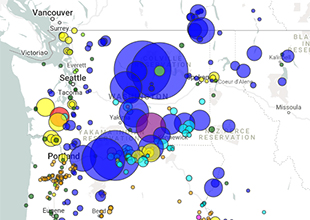
Power Generation: Northwest power facilities by resource with detail for each facility
Dam Guide: Tour and history of Columbia River Basin hydropower projects
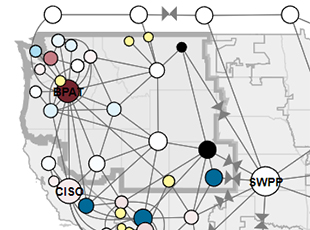
Power supply outlook
The outlook provides a daily snapshot of reservoir levels, water flows, and power flows in the Northwest.
External resources
California ISO outlook: California leads the nation in utilizing renewable energy resources. Its increasing reliance on solar energy is expected to affect Northwest energy markets. See their real-time charting of renewable electricity usage.
EIA electricity dashboard: Lots of real-time electric grid info