Spring snowpack was near normal in parts of the Columbia River Basin, but melted quickly
Hydropower generation predicted to be near 10-year average in 2025
- May 30, 2025
- Peter Jensen
Climate and water supply forecasting is a vital component of annual water management for Columbia River system operations. It also informs long-term planning and decision-making on operations that affect both hydropower supply and fish passage and survival.
At May’s Council meeting in Pasco, Wash., the Council listened to a briefing by Amy Burke, Senior Hydrologist for the Northwest River Forecast Center, on the snowpack that built up in the Columbia River Basin this past winter and how it would affect the water supply for the upcoming seasons. (Read presentation | watch video)
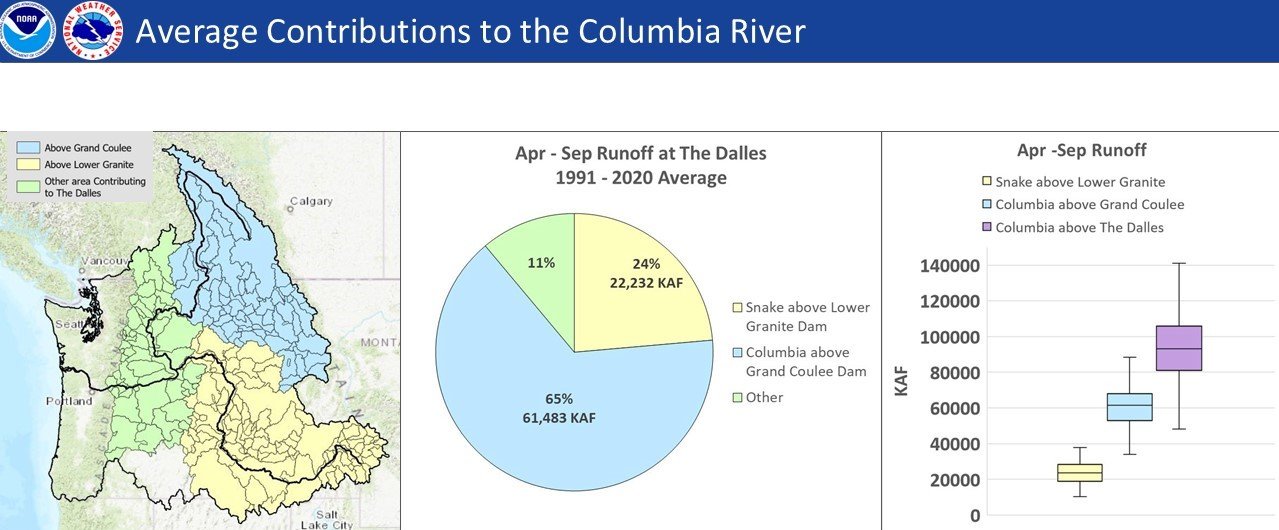
Throughout the past winter, the snowpack peaked higher than normal in the south and lower than normal in the north, similar to 2023 and 2024. Snowpack in the north portion of the Basin provides the most water in the Columbia River. For the April-September average runoff at The Dalles between 1991-2020, the portion above Grand Coulee Dam supplied 65% of the water flow while the Snake River above Lower Granite Dam supplied 24%. Other portions of the Basin, such as the Cascade Mountains in Washington and parts of Central Oregon, contributed 11%, according to the River Forecast Center.
On April 2, the River Forecast Center reported that the Basin snowpack was near normal - although the levels were an improvement from 2023 and 2024. For the Basin above Grand Coulee Dam, the snowpack was 89% of normal – but improved from the prior two years. The Snake Basin above Lower Granite Dam was 100% of normal, in line with 2024 but an improvement from 2023. The Columbia Basin above The Dalles Dam was 95% of normal - but also improved from the prior two years.
April and May were warmer and drier than usual in the Pacific Northwest. On May 11, the Basin snowpack had been reduced – above Grand Coulee it was 84% of normal; 91% of normal above Lower Granite; and 88% of normal above The Dalles.
“We are in the middle of rapid snowmelt,” Burke said. “The water supply forecasts have decreased significantly since the start of April.”
Here’s how the water supply forecast shifted over that six-week period. All percentages are of normal from April-May through September 2025:
Upper Columbia Basin
| April 2 | May 11 | April 2 | May 11 | ||
| Mica | 87% | 81% | Duncan | 88% | 87% |
| Queens Bay | 84% | 83% | Libby | 79% | 76% |
| Hungry Horse | 92% | 90% | Grand Coulee | 90% | 86% |
Snake River Basin
| April 2 | May 11 | |
| American Falls | 103% | 79% |
| Lucky Peak | 119% | 97% |
| Dworshak | 91% | 80% |
| Lower Granite | 98% | 90% |
Lower Columbia Basin
| April 2 | May 11 | |
| The Dalles | 90% | 86% |
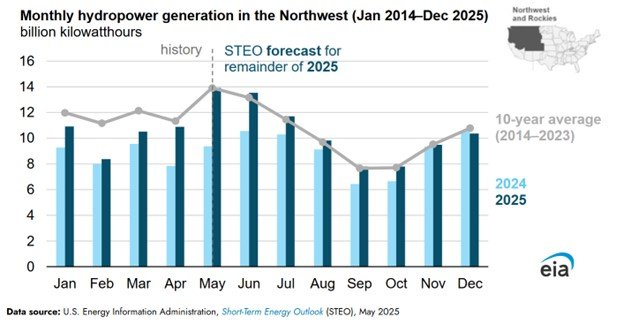
Hydropower generation predicted to be near 10-year average
Based on the River Forecast Center’s May outlook, the Energy Information Administration produced a new forecast for hydropower generation in the Northwest for the remainder of 2025. The EIA’s geographic territory also covers the Rocky Mountain region.
The forecast predicted hydropower generation in the Northwest and Rockies region to be a 17% increase over 2024, while 4% less than the 10-year average.