Ninth Power Plan reaches key milestone, and Council reviews preliminary energy efficiency, demand response potential
Ninth Plan will feature major shift in residential energy efficiency potential, while EV load forecast drives up demand-response potential
- June 27, 2025
- Peter Jensen

The Council is in the process of developing its Ninth Power Plan, with the goal of having a draft done by mid-2026 and a final version adopted by the end of that year. This plan will include a cost-effective resource strategy that will ensure the Pacific Northwest’s power system continues to be adequate, economical, efficient, and reliable over the next 20 years.
At the Council’s June meeting in Missoula, Power Planning Director Jennifer Light gave an update on the process of developing the Ninth Plan while noting that a key milestone has been reached (read presentation | watch video). She also led a discussion of a hydro operations scenario, and Power Division staff presented the preliminary, total potential for energy efficiency and demand response for the Ninth Plan.
Light reported that staff has finished the modeling inputs for the Ninth Plan, including generating resource reference plants, a 20-year load forecast, demand-side resource supply curves, fuels price forecasts, and resource adequacy metrics and thresholds, among others. Review all of the Ninth Plan’s completed methodologies and inputs here.
Beginning this summer, staff will be transitioning to performing scenario modeling, including conducting market studies and a system-wide needs assessments. This next phase of power planning is expected to run from summer 2025-winter 2026. After that, the Council will be analyzing and discussing the modeling results and developing the Ninth Plan’s recommendations. The Council is expecting to spend the spring months of 2026 drafting the plan, with the goal of releasing the draft by July 2026.
One part of the process of developing the Ninth Power Plan will include a scenario analysis that explores potential changes to hydropower operations. At the June meeting, Power as well as Fish and Wildlife Division staff and the Council Members discussed a range of potential questions that could be explored within this scenario (read presentation | watch video). Staff and Council Members will spend more time in the coming months working toward a defined scope for this scenario.
The Ninth Plan’s energy efficiency potential
The Council’s past power plans have helped make the Northwest a national leader in acquiring cost-effective energy efficiency. Since 1980, the four-state region of Oregon, Idaho, Montana, and Washington has met more than half its load growth with energy efficiency, which has helped save more than $5 billion in avoided energy costs and in consumer savings.
At the June meeting, Kevin Smit, Manager, Power Planning Resources and Christian Douglass, Senior Resources Analyst presented the preliminary results for the total potential for energy efficiency for the Ninth Plan (read presentation | watch video). It’s important to note that this is technical achievable potential. While staff has determined the costs for acquiring it and has broken the potential out by sector and by specific measures, they haven’t yet determined how much of it is cost-effective.
That comes later in the Council’s power planning process, likely this fall and winter of 2025 and spring of 2026 as staff conducts scenario modeling that tests future build-outs of the Northwest’s electricity grid and compares the efficiency and demand response potential apples-to-apples with other possible generating resources for the grid, such as building new wind, solar, or natural gas plants. The Northwest Power Act places a clear emphasis on prioritizing cost-effective energy efficiency, not just any and all available energy efficiency.

The total amount of energy efficiency potential for the Ninth Plan will be similar to the 7th Plan and the 2021 Plan, although with one major shift. Over the next 20 years, staff expects zero efficiency potential from residential lighting, like LED lightbulbs. Residential lighting was an efficiency workhorse in the 7th Plan but LEDs are now current practice or covered under efficiency standards.
The region has consumed approximately 22,000 aMW (average megawatts) of electricity per year for the last several years. In 2027, at the start of the Ninth Plan’s planning horizon, the residential sector is forecasted to be the largest source of electricity demand in the region at approximately 10,000 aMW. Commercial will consume approximately 6,500 aMW and industrial (including agriculture) will be at 5,700 aMW. The residential sector in the Northwest covers approximately 6.5 million households currently. By 2046, the Council forecasts that to grow to 7.5 million.
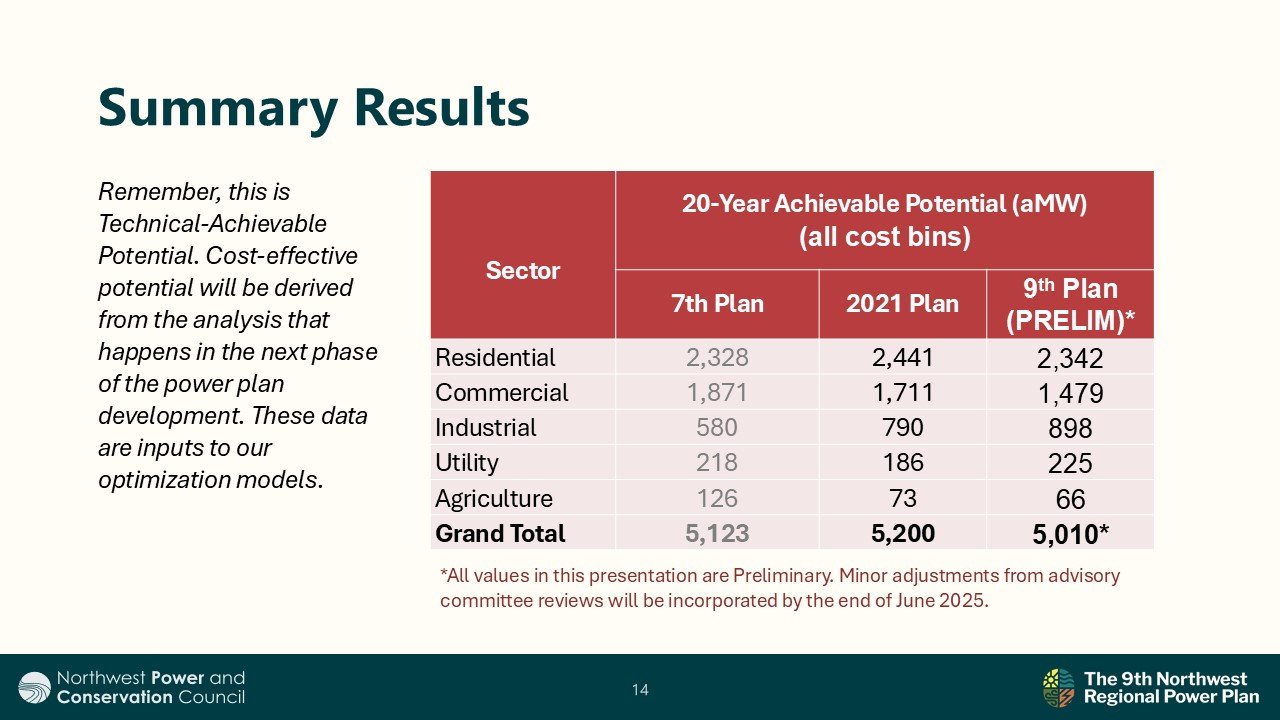
- The residential sector has 2,342 aMW total potential, including 1,216 aMW from HVAC (including heat pumps & central AC upgrades).
- The commercial sector has 1,479 aMW of total potential efficiency, including some from lighting, although it’s mainly from controls. HVAC is the largest source of potential with 916 aMW.
- In the industrial sector, 898 aMW of total potential has been identified, with strategic energy management as the largest source with 228 aMW.
- The agricultural sector has 66 aMW of total potential.
- Finally, staff has identified approximately 225 aMW of efficiency potential from conservation voltage regulation in the electricity grid’s distribution system.
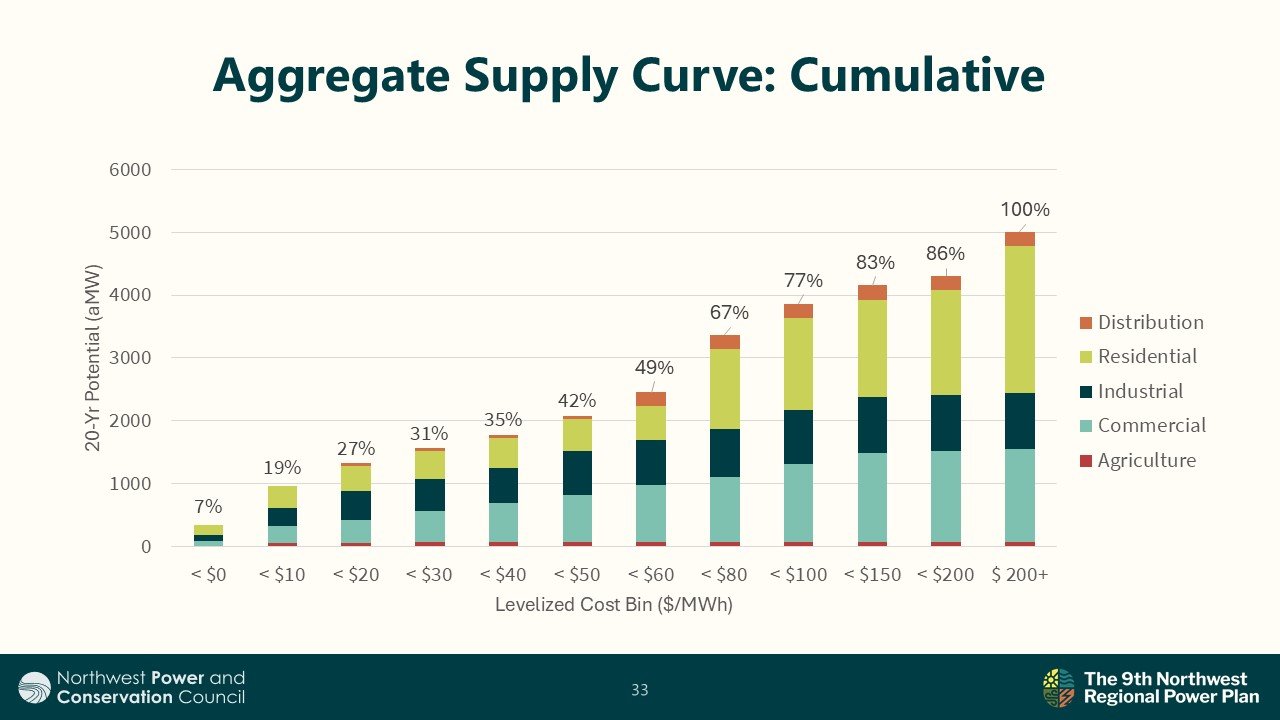
Taken cumulatively and broken out by cost, staff presented the following supply curve to the Council. It showed that two-thirds of the energy efficiency potential identified over the next 20 years will be available at costs equal to or less than $80/MWh.

Demand response
Next, Energy Resources Analyst Joe Walderman led the Council through a presentation about the total, preliminary potential for demand response that staff has identified over the next 20 years for the Ninth Plan (read presentation | watch video). Similar to energy efficiency, this is technical achievable potential. Determining how much is cost-effective will come later in the planning process through apples-to-apples comparisons with other supply- and demand-side resources.
The plan will consider 28 distinct demand response products, which are assessed for both their summer peak and winter peak potential. The total demand response resource is just over 4,100 MW of summer potential (up from 3,700 MW in the 2021 Plan) and just over 3,500 MW of winter potential (up from approximately 2,750 MW in the 2021 Plan).
The increased potential is due in large part to the addition of new products like behind-the-meter batteries, incorporating the Council’s new load forecast for electric vehicles, and expanded thermostat programs. Published in late April, results of the new load forecast showed that electric vehicles are forecast to reach 1,000 aMW of electricity demand by 2030, and between 5,500-6,500 aMW of demand by 2046. For reference, the city of Seattle consumes about 1,000 aMW of electricity every year.
Unmanaged electric-vehicle charging often occurs in after-work hours, which coincides with other peak hour power needs. Demand response programs could manage the charging in several different ways that have less impact on power system peaks – such as after midnight. The initial load forecast assumes unmanaged charging, leaving the demand response potential of managed charging as an option for Power Division staff’s computer models to choose when they analyze different resource strategies for building out the Northwest electricity grid in the future.
Walderman presented the total results for each source of demand response potential:
- EVs are the largest source of potential, at 1,476 MW. This includes 862 MW of time-of-use potential, and 614 MW for active managed charging.
- Residential HVAC has 862 MW of potential, including 618 MW from Wifi-enabled smart thermostats.
- Commercial HVAC has 117MW of potential, focused on thermostat and load switch products for office and retail customers. Larger buildings are covered under C&I curtailment products.
- Commercial and industrial customer curtailment potential was assessed to have 201 MW of potential. This product provides incentives for custom load curtailment strategies and event-based energy shifts, and assumes participants would nominate 25% of their load for curtailment.
- Irrigation potential was assessed to be 89 MW. Idaho Power and PacifiCorp have existing programs that have been around for years and total 328 MW of capacity.
- Price-based and system demand response products have 935 MW of potential, including 571 MW from demand voltage regulation that reduces demand and manages voltages in the electricity grid at peak periods.
- Battery-based products for residences will have 499 MW of potential.
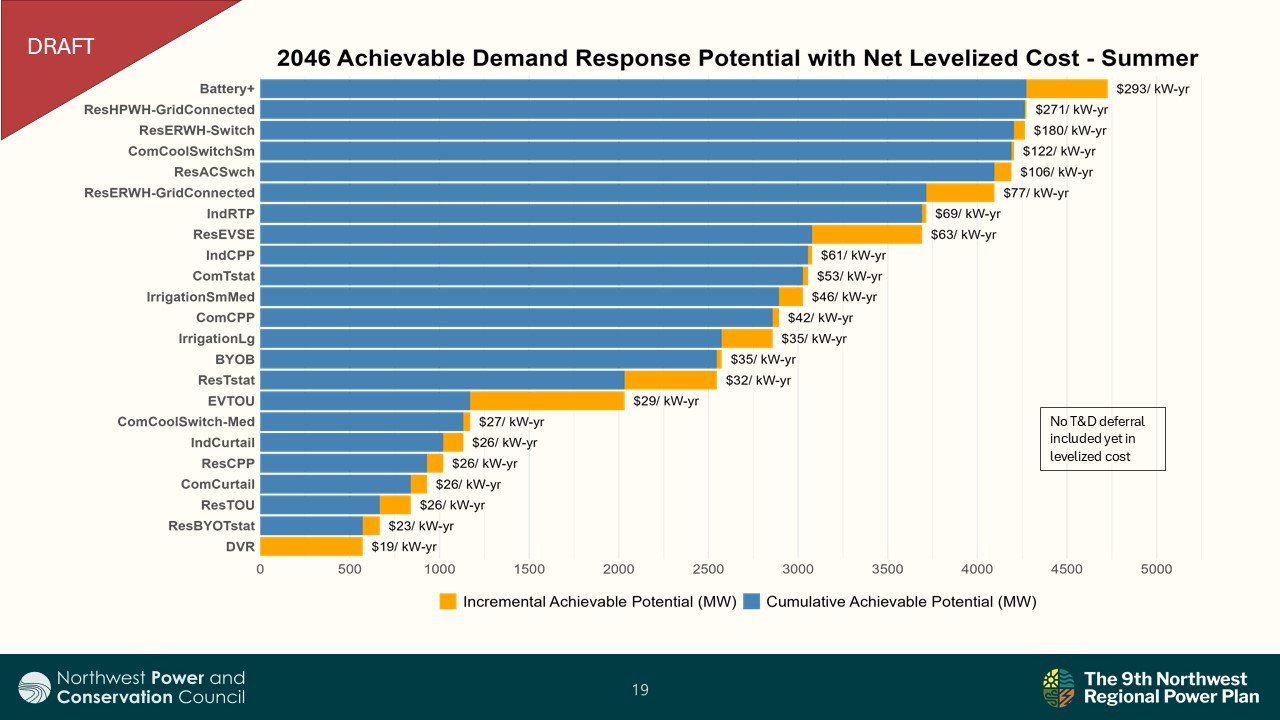
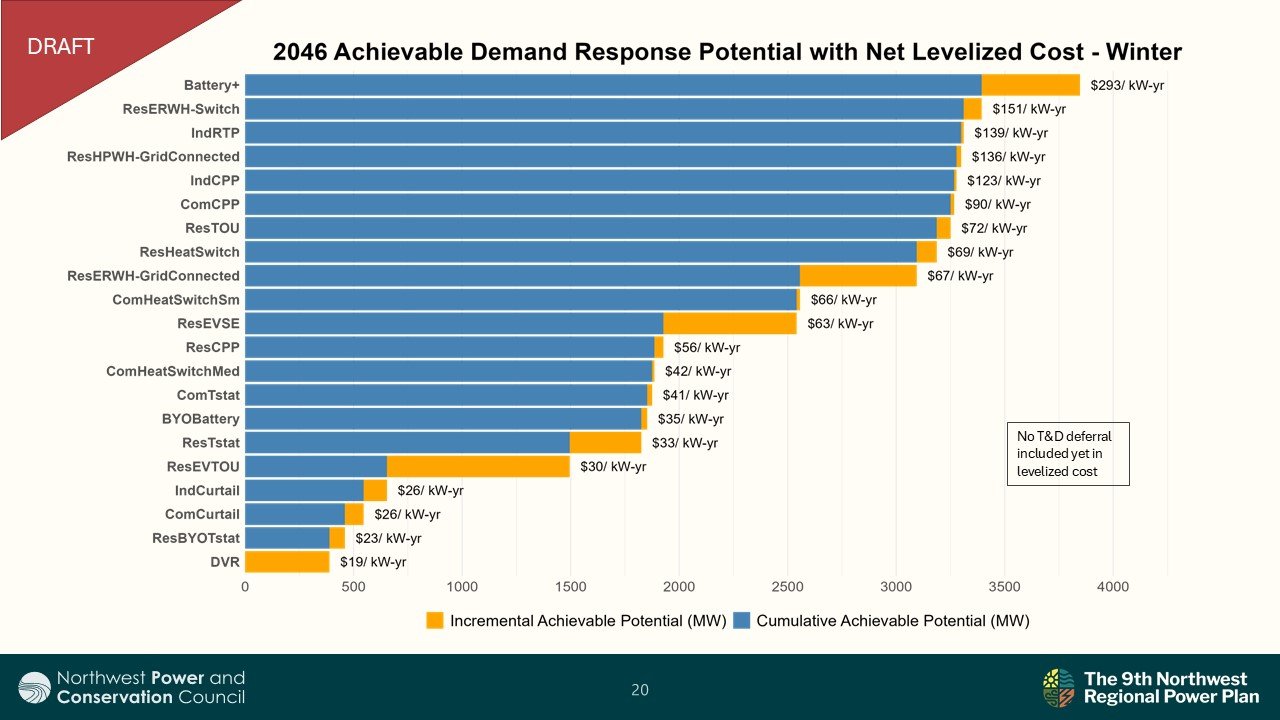
The following charts show these products’ levelized costs broken out by winter and summer.


