


Council briefing: How Power Division staff test and analyze possible future buildouts of NW electricity grid
Staff is working to bring modeling results to the Council at its April meeting in Whitefish, MT
- February 25, 2026
- Peter Jensen
Under the Northwest Power Act, the Council’s power plans for the Pacific Northwest’s electricity grid extend 20 years into the future, although they are reviewed and updated in approximately five-year cycles. The Ninth Power Plan will cover the years 2027-2046, and the Council has winnowed down the scope of the analysis for how the next two decades could unfold. We're aiming to have a draft ready for public review and comment by mid-summer, and to adopt the final plan by November 2026.
The scope of the analysis includes two primary scenarios with 13 sensitivities covering different potential hydrosystem operations in the Columbia Basin and future uncertainty for the pace and scale of transmission and resource development in the Northwest. It will also encompass 13,500 unique futures spanning varying trajectories in future load growth, a wide swath of hydro and variable energy resource generation informed by a range of climate conditions, as well as natural gas price variation and price trajectories. The Ninth Power Plan also analyzes load growth and resources within 17 zones in the region.
How can you slice through such a broad dataset to see clear signals? Power Division staff are using a suite of advanced, innovative computer modeling tools as well as statistical methods to glean insights, test, and analyze future potential buildouts of the Northwest’s electricity grid over the next two decades. At February’s Council meeting, staff provided a primer on their modeling tools and statistical methods, as well as the type of data that will be available once modeling is completed this spring. (Read presentation | watch video)
Staff anticipates having these modeling results ready for the public to review at the April Council meeting in Whitefish, Montana. This analysis will help inform the Ninth Plan’s cost-effective resource strategy, which will identify the supply- and demand-side resources the Northwest will need to add to its electricity grid to ensure the region continues to experience an adequate, efficient, economical, and reliable power supply through 2046.
These modeling results won’t simply be taken as gospel, though. They’re one piece of information that will help Council members and staff develop the plan’s resource strategy. The Northwest Power Act also recognizes the critical importance of public engagement from throughout the four-state region. Once the Ninth Plan is ready to be released for public review and comment this summer, the Council will hold a series of public hearings in cities and towns throughout the Northwest to solicit feedback and input.
Modeling suite
Staff use several computer modeling tools to assist them with various components of the power system planning process. For example, the Council’s load forecasting uses a tool developed by Itron, which produces hourly weather processing and load shaping for bottom-up, long-term end-use load forecasts. A tool called Aurora helped staff conduct WECC-wide market availability studies, where different sensitivities were tested depending on a range of resource and transmission options. For the Ninth Plan’s needs assessment, staff feed the load forecast, market availability studies, and other datasets into a tool called GENESYS (made by PSR) to analyze what the power system needs when existing system operations shift in the future.
At this juncture in the Ninth Plan’s process, staff are using a modeling tool called OptGen/SDDP (also developed by PSR) as well as GENESYS. OptGen/SDDP performs regional resource optimization – expansion planning that determines the least-cost sizing and timing decisions for construction, retirement and reinforcement of generation capacities, the transmission network, and natural gas pipelines. This helps test and analyze various buildouts of the Northwest’s grid including supply- and demand-side resources. Next, staff use GENESYS to ensure that these buildouts meet the Council’s resource adequacy standards for the region.
Capturing uncertainty
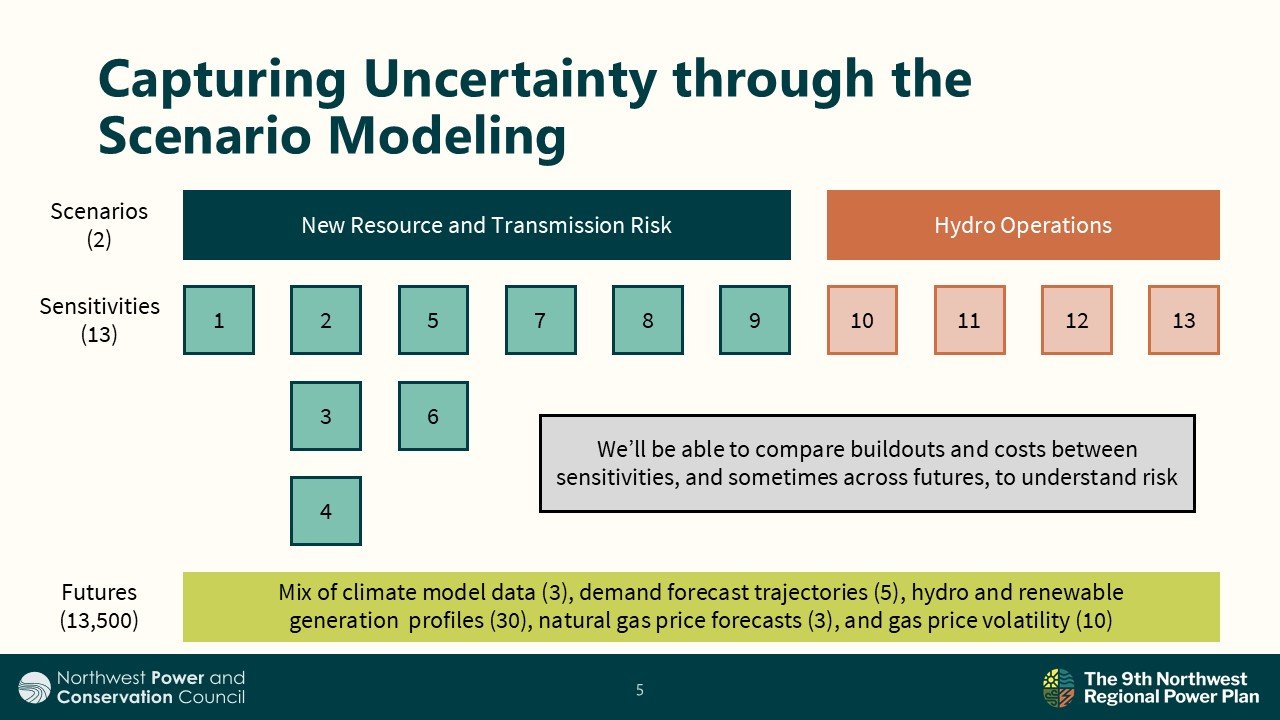
This chart shows the broad future landscape that the Council will be analyzing. In identifying the right portfolio of resources to add to the grid, the model seeks to meet energy needs at the least cost, across this range of futures. Other data helps guide the model:
- Resource costs, including capital and ongoing expenditures
- Resource availability, including online dates, minimum/maximum generation requirements, and resource generation attributes
- Adequacy requirements, including energy and capacity reserve margins
- Reserves, including dynamic probabilistic reserves, planning, and contingency, among others
- Hydro system constraints, including spill, storage, outflows, and irrigation
- Policy requirements, including emissions costs and energy targets
Major drivers for resource builds in the models are economics, because the model seeks least-cost builds across ranges of uncertainty, as well as ensuring an adequate power supply and meeting policies.
Modeling approach
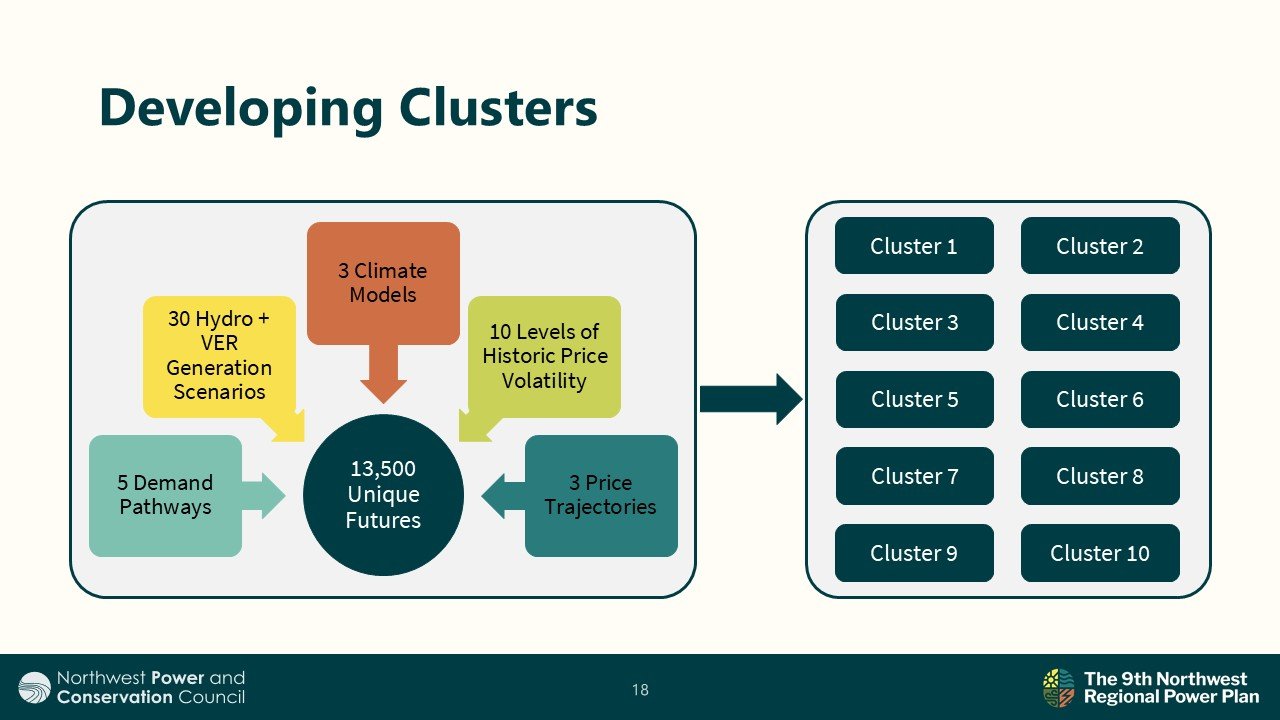
To simplify the process and help glean the most useful information, staff sampled years to model, and applied an analytical technique to determine how to cluster the range of the 13,500 futures.
The years selected for modeling will be 2028, 2030, 2032, 2034, 2038, 2042, and 2046. The first three are within the five-year action period for the Ninth Plan (2027-2032). 2034 and 2038 are mid-way through the 20-year horizon, and more resources like geothermal and pumped storage become available as possible resource solutions. Finally, by 2042 most resources will be available to the model, and 2046 is the last year of the study.
Staff is clustering information from the set of 13,500 futures that still cover the economic risk from uncertainty in load, generation, gas price forecasts, and climate trajectories. Staff has selected 10 future clusters that will be modeled for each the study years. Each sample year will have its own 10 clusters that represent the uncertainty. Since we have seven sample years, there will be seven different sets of clusters, ultimately resulting in 70 clusters.
Understanding forthcoming results
Resource buildout
Power Division staff then explained what the modeling results will look like once the analysis is completed and ready for public review. The model will produce a resource buildout showing different resources by type, amounts, and by year. This helps the Council understand which resources are built under specific future conditions and analyze what that means for mitigating risk and uncertainty. This information will be available for the region as a whole, as well as by the 17 zones.
Cost information
The model will provide a wide range of information on costs that will provide insights on least cost planning. This includes understanding the levelized cost of resources selected and market prices, which together can provide information on the reason why certain resources are being acquired. The model also provides investment costs, which informs the overall cost of developing the portfolio. Additionally, there is information on production and other costs, which can vary by future, that offers insights into risk.
Resource utilization
The model provides data on generation and reserves for various resources, including those in the existing system and any new thermal resources picked up in the study.
Other data
The modeling will produce vast quantities of data. This will include other analytical areas to explore, such as WECC-wide emissions, imports and exports, and insights into why resources are built for reasons beyond just economics, such as responding to policy or adequacy signals.