


Changing Intensity of Regional Energy Use
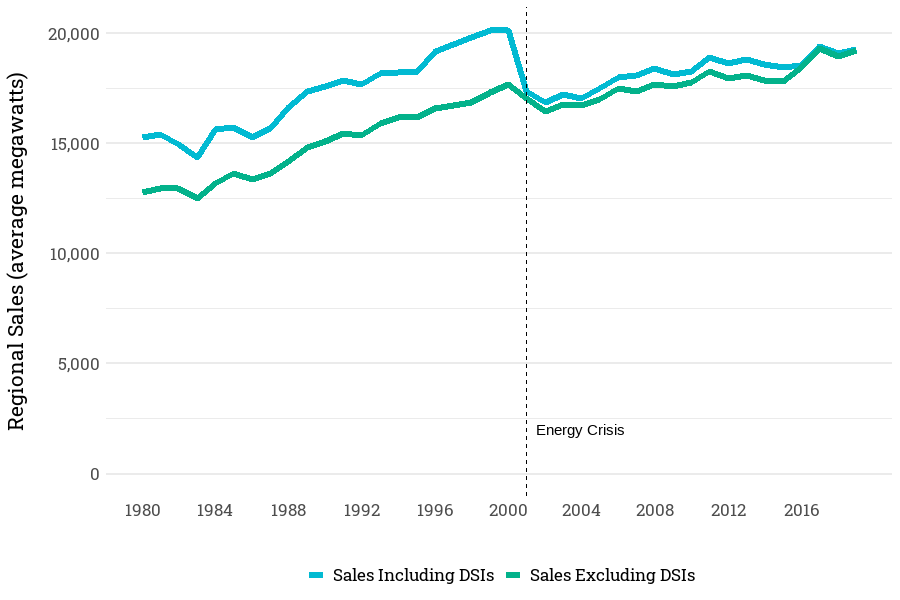
It has been about 40 years since Council’s establishment and 38 years since the release of the first power plan in 1983. Since then, the region’s energy environment has undergone many changes. These changes have enabled the Northwest economy to grow, while growth in demand for energy has been kept low. In the decade prior to the Northwest Power Act, regional electricity load was growing at 3.5 percent per year and load (excluding the direct service industries – mainly aluminum smelting) grew at an annual rate of 4.3 percent. In 1970, regional load was about 11,000 average megawatts, and during that decade demand grew by about 4,700 average megawatts. During the 1980s, load growth slowed significantly but continued to grow at about 1.5 percent per year, experiencing load growth of about 2,300 average megawatts. In the 1990s, another 2,000 average megawatts were added to the regional load, making load growth in the last decade of the 20th century about 1.1 percent. Since 2000, regional load has declined. As a result of the energy crisis of 2000-2001 and the recession of 2001-2002, regional load decreased by 3,700 average megawatts between 2000 and 2001. Loss of many of the aluminum and chemical companies that were direct service industries contributed to reduction in demand for electricity. For the past 20 years, total regional demand has been recovering, but has not surpassed the demand level recorded in the year 2000. This growth has been driven by increasing demand from the commercial and residential sectors. The following figure and table track the regional electricity sales from 1980s-2018. In 2001-2018 the average annual growth rate is between 0.2 and 0.3 percent.
Total and Non-DSI Regional Electricity Sales (aMW)[1]
Average Annual Growth Rate for Total and Non-DSI Regional Electricity Sales
| 1980-1989 | 1990-2000 | 2001-2007 | 2008-2018 | |
| Total Sales | 1.6% | 1.4% | 0.4% | 0.1% |
| Sales net DSI | 1.9% | 1.6% | 0.2% | 0.5% |
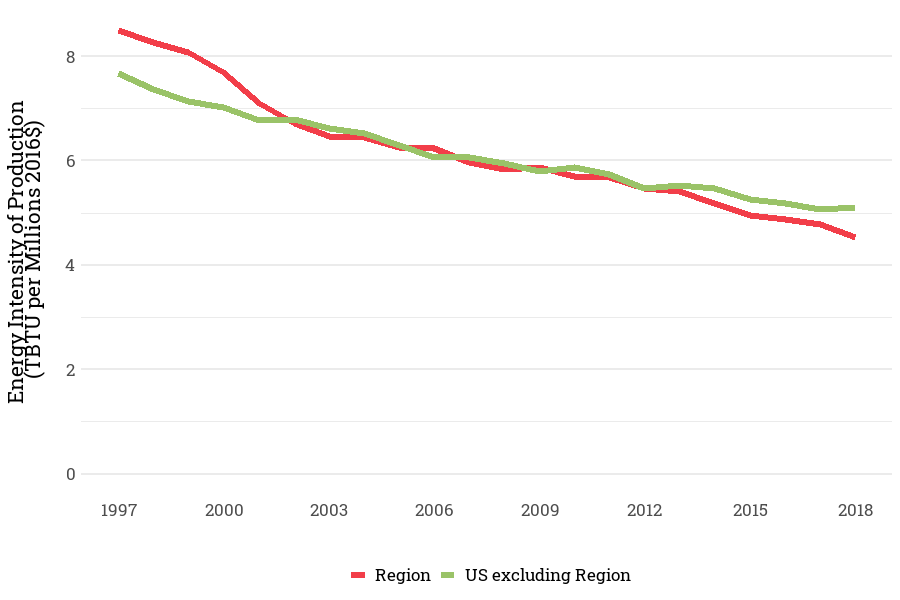
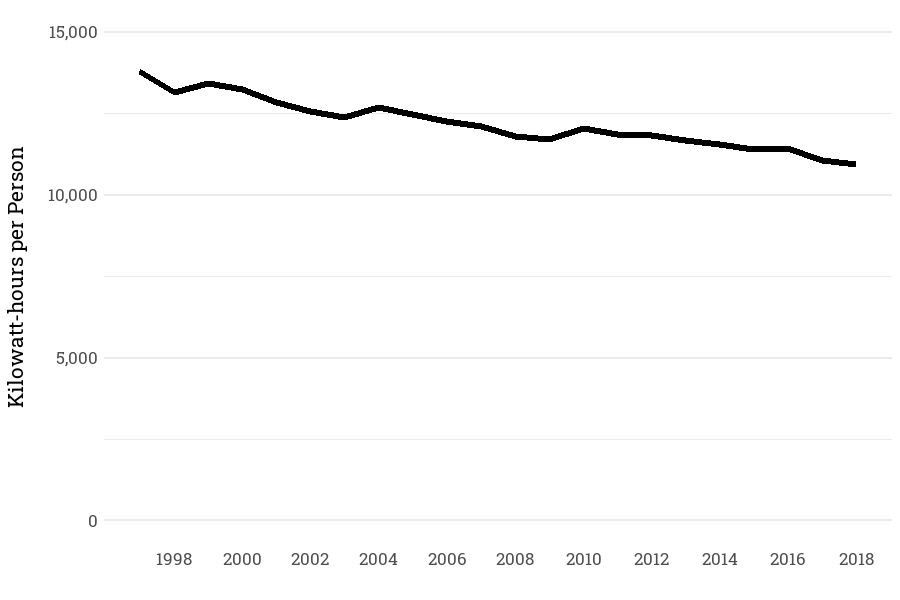
The dramatic decrease in the growth of electricity demand shown in the above table was not due to a slowdown in economic growth in the region. On the contrary, the region added over 5.6 million people between 1986 and 2018. The decrease in demand was the result of a move to less energy-intensive activities as well as expanded energy efficiency investments. As shown in figures below, both energy and electric intensity (TBTU per dollar of output and per capita electricity use) show significant declines in the past decades. This shift reflects industry changes, increasing electricity prices, and regional and national conservation efforts. Note that the graph below shows total energy intensity (includes all forms of energy) not just electricity.
Trends in Energy Intensity Per dollar of Gross State Product 1997-2018
Per Capita Demand for Non-DSI Electricity (Weather Normalized)
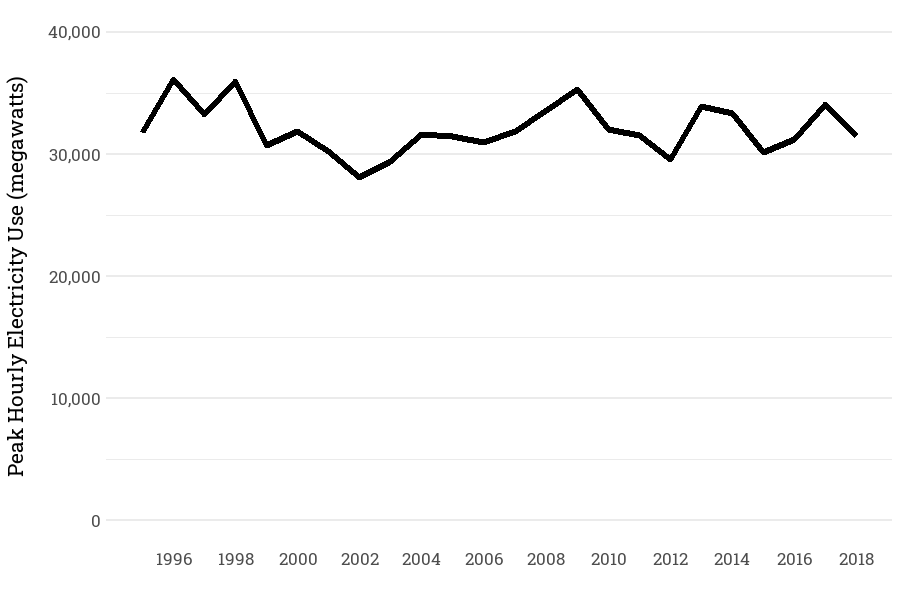
Historic Regional Peak Electricity Use
The electrical system in the Northwest must meet loads 24/7 throughout the year. Not only average load but also peak and off-peak loads must be met. In this section we provide our range of forecast for peak and off-peak loads. The actual peak loads shown for 1995-2012 reflect weather conditions at the time of system peak. The peak load projections for the forecast period assumes normal weather. Peak loads in the historic period 1995-2018 have not shown much growth; they have actually gone down by about -0.05% per year.
Observed Historic Peak Electricity Use
Seasonality of Historic Regional Energy Use
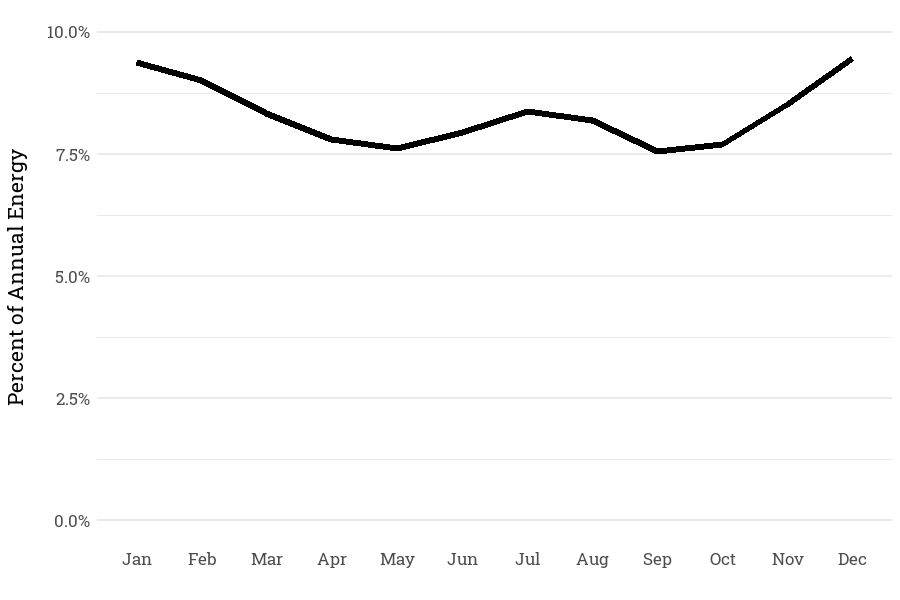
The annual loads we have been discussing so far are not evenly distributed throughout the year. The electric system in the Northwest is a winter peaking system. The historic demand for electricity for the region shows a “W”-shaped profile. Approximately 9-10 percent of annual electricity in the region is consumed in the winter months of January and December. In the shoulder months (March through June, and September through November) monthly energy consumption is about 8 percent. In summer months, it is slightly above 8 percent. Similar patterns can be observed in each one of the four states, with electricity demand in Idaho slightly higher in summer and slightly lower than the regional average in winter months.
Monthly Pattern of Demand for Electricity
Historic Trends by Economic Sector
Residential Sector
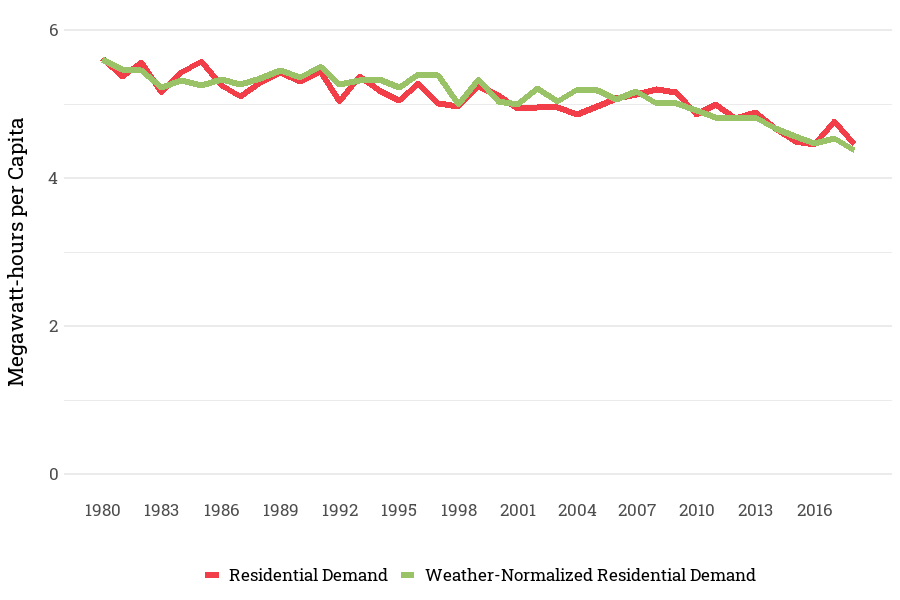
Residential load for electricity grew from 5,350 average megawatts in 1986 to about 8,116 average megawatts in 2018. Although residential demand for electricity has been increasing, the per capita consumption of electricity in the residential sector shows continued decline. Improved building codes and more efficient appliances helped to keep the consumption level down. Since 1980, per capita demand for electricity fell from over 5.5 MWH to less than 4.4 MWH a decline of over 20 percent.
Residential Demand for Electricity per Person
The drop in residential per capita consumption of electricity is even more significant when considering the tremendous increase in home electronics and air-conditioning. Electronic devices that did not even exist 30 years ago, have added to residential demand. The demand for information, communication, and entertainment (ICE) appliances has sky-rocketed and are expected to continue. However, the more recent trends suggest a slowdown in growth for this sector. This is in part due to changes in consumer preferences, expansion of mobile communication devices and a number of voluntary industry and federal standards.
Commercial Sector
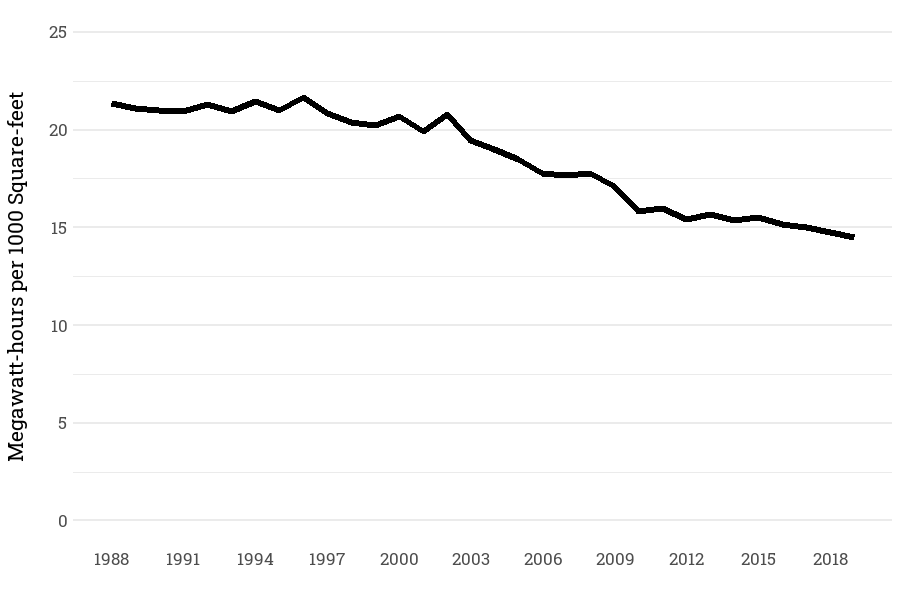
Electricity load in the commercial sector has increased regionally and nationally. In 1986, demand in the commercial sector of the region was about 4,000 average megawatts and by 2018 this sector required over 6000 average megawatts. Electricity use intensity in the sector has improved, both in terms of value of goods and services produced by commercial sector per MWH of electricity demand and in terms of electricity demand per square footage of commercial business. The graph below shows, electricity intensity in the commercial sector measured in megawatt hours used per square foot of space. In 1997, the commercial sector’s average electricity intensity was about 19 megawatt hours per 1000 square foot (19 kWh/sf). By 2018, it had dropped to about 14.6 megawatt hours per 1000 square foot (14.6 kWh/sf).
A major factor that influences the demand for electricity in the commercial sector is the presence of embedded data centers. These data centers are different that the stand-alone data centers where the main business of the business is providing data services. In the embedded data centers, the main function of the data center is to support the key business.
Electricity Intensity in the Commercial Sector by Floorspace
Industrial Sector
The Northwest industries have been able to increase their electricity efficiency of use over time. From 1985 to the late 1990s industrial production per unit MWH was between 1000-1500 $2016/MWH. After the fall of Direct Service Industries (particularly aluminum smelting operations) the value of manufacturing output per MWH increased to about $2500/MWH.
In the Northwest, the non-DSI industrial sector demand is dominated by pulp and paper, food processing, chemical, primary metals other than aluminum, and lumber and wood products industries. Many of these industries have declined or are experiencing slow growth. These traditional resource-based industries are becoming less important to regional electricity demand forecasts, while new industries, such as semiconductor manufacturing, are growing faster and commanding a growing share of the industrial-sector load.
[1] Two electricity sales trends are shown in the graph; the first set is for total sales and the second set is for non-DSI sales