


The general methodology for all energy efficiency measures can be found here. The sections below provide an overview specific to the industrial sector.
Overview of Methods for Industrial Sector
The industrial sector energy efficiency assessment utilizes a top-down methodology for retrofit measures and a bottom-up method, similar to other sectors, for lost opportunity measures. For the top-down model, the overall industrial load is forecasted by state and region. As part of this forecast, the loads are disaggregated into the 21 industrial segments. The consumption estimates are then split into estimates of electricity use by major process end use. Then, energy efficiency measures are applied to the end use, estimated as a percent savings with associated costs. Finally, factors for measure applicability, measure interaction, maximum achievability, and achievability rates over time are applied.
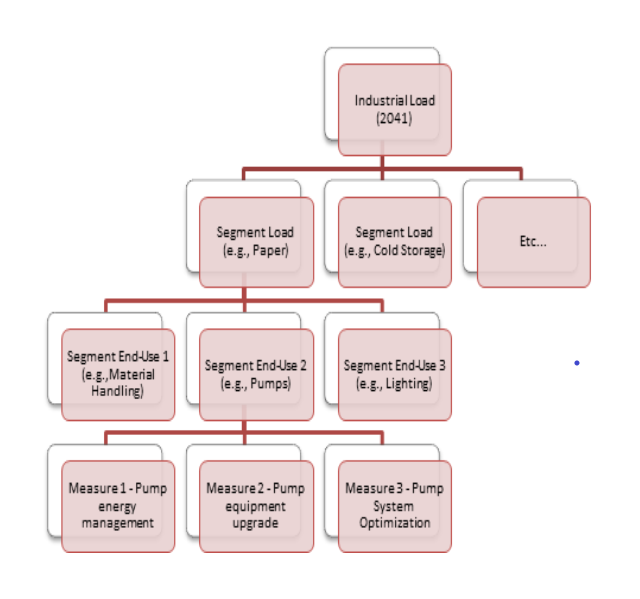
The overall structure of the industrial sector retrofit model is shown in the figure below. The physical units are derived from the forecasted 2041 industrial load. Each industrial segment has a unique set of end-use loads, and each end-use load has a measure or set of measures associated with it. Since the measures are defined as a percent savings share of the end-use load, the resulting savings are total for the region rather than for an individual facility or process.
Industrial Model Structure
The method for the lost opportunity measures (fans, pumps, air compressors, and advanced motors) is a bottom-up approach like the other sectors. These measures utilize a current practice baseline based on DOE shipment data for the nation and factored for regional use. The shipments define the number of annual units and are multiplied by the savings per unit.
Physical Units for Industrial
The conservation potential in the industrial sector covers a broad range of measures in 21 industrial segments including water supply and wastewater treatment but excluding the direct service industries. The industrial sector utilizes a top-down methodology for estimating the conservation potential, so the key driver is total load by segment. The industrial segments and their 2022 (start year) and 2041 (end year) loads are shown in the table below. Note that in our base case the industrial consumption is forecasted to decline overall and for most segments, though about a third of the segments are projected to increase.
Industrial Loads in 2022 and 2041
| Industrial Segment | 2022 MWh | 2041 MWh |
| Water Supply | 1,032,790 | 1,228,952 |
| Wastewater Treatment | 1,052,610 | 1,252,537 |
| Frozen Food | 2,295,990 | 2,121,376 |
| Other Food | 3,140,913 | 2,902,041 |
| Wood - Lumber | 1,552,851 | 973,265 |
| Wood - Panel | 548,975 | 344,075 |
| Wood - Other | 3,049,346 | 1,911,207 |
| Pulp and Paper Mills (TMP) | 2,950,713 | 1,998,610 |
| Pulp and Paper Mills (Kraft) | 2,945,325 | 1,994,960 |
| Paper Conversion Plants | 523,751 | 354,753 |
| Refinery | 2,409,559 | 1,056,280 |
| Chemical Manufacturing | 4,882,292 | 5,331,472 |
| Silicon Growing/Manufacturing | 402,880 | 416,116 |
| Cement/Concrete Products | 2,070,482 | 1,615,249 |
| Primary Metal Manufacturing | 456,333 | 440,776 |
| Fabricated Metal Manufacturing | 1,247,723 | 1,118,951 |
| Semiconductor Manufacturing | 4,148,451 | 4,284,741 |
| Transportation Equipment | 2,800,070 | 3,966,859 |
| Misc. Manufacturing | 2,233,447 | 2,212,994 |
| Refrigerated Warehouse | 934,285 | 863,231 |
| Fruit Storage | 1,662,283 | 1,535,863 |
| Total | 42,341,068 | 37,924,310 |
Industrial Baseline Characteristics
The baseline characteristics of the industrial sector are defined by the electricity end-uses in each of the segments.
One of the primary baseline components is the industrial load by segment. These baseline loads are based on the regional end-use load forecast for the industrial sector. Prior to the 2021 Plan, the Council conducted significant new segment-specific research to quantify the industrial load by segment for a base year (2016). Segment loads were then calibrated with total industrial loads obtained through the Energy Information Administration (EIA) Form 861, which collects and reports utility sales by segment annually. The Form 861 data are adjusted for other non-industrial data that include agriculture/irrigation and large data centers, which are treated separately in our load forecasts and potential assessments.
A second major baseline component is the share of consumption by end-use. Estimated end-use shares were developed and revised using segment specific research and input from regional energy efficiency program implementers. Other sources for this information include the Industrial Facilities Site Assessment and the Energy Information Agency’s Manufacturing Energy Consumption Survey.
Retrofit measure baseline saturation updates were made by reviewing the conservation measures completed since the Seventh Power Plan. Data were provided through the annual regional conservation progress (RCP) report. In some cases, savings data were projected for 2019 and 2020. These achieved savings were used to update the baseline saturation of measures.
For lost opportunity (i.e., natural replacement) measures, a current practice baseline was used. For many of the motor-driven devices (e.g., fans, pumps, compressors), DOE shipment data were used to identify the number of units and shares of efficient units coming into the markets.
Industrial Measure Applicability and Achievability
Each of the 46 industrial measures has an applicability associated with it, specified by industry. The applicability includes both the physical applicability and the remaining available fraction. For example, the “refrigeration retrofit” measure only applies to industries with refrigeration loads and is less than 100% in those industries to account for the fraction of potential remaining. These applicability values can be found in the Industrial Tool Excel file (Industrial_Tool_2021P_v08.xlsm)
The industrial measure technical maximum achievability is largely 85 percent for retrofit measure, and 95 percent for the lost opportunity measures, similar to the other sectors. Lost opportunity measures were included in the 2021 Plan and were not in the Seventh Plan.
Guide to Industrial Workbooks
The table below lists the individual workbooks utilized in the industrial sector assessment. The most recent versions of these workbooks are posted on the Council’s website and are available for downloading.
Industrial Sector Supply Curve Input Workbooks
| Item | Description |
| Measure Analysis Tool Industrial_Tool_2021P_v08.xlsm | Excel workbook containing the major elements of the industrial sector characterization, the estimates of end use splits and the details on the energy conservation measures. Passes the measure data to the “AllMeasures” workbook |
| Industrial Supply Curve Workbook IND_AllMeasures_2021P_V8.xlsm | Excel workbook which translates the costs and savings from the Measure Analysis Tool into supply curve data for the Regional Portfolio Model. Uses ProCost to develop NRC Net levelized costs. |
| Individual Measure Workbooks IND-AirComp-2021P_V7.xlsx IND-Fans-2021P_V6.xlsm IND-Lighting-2021P-V9.xlsx Ind-OtherMotors-2021P_v4.xlsx IND-PUMPS-2021P_V6.xlsm Ind-SEM-2021P_V3.xlsx Ind-Wastewater-2021P_V5.xlsx Ind-WaterSupply-2021P_V5.xlsm | These workbooks contain separate analyses for individual categories of measures. Data from these workbooks are passed into either the Industrial_tool or the Ind_AllMeasures workbooks, or both. |
| Other Supporting Files IND-LightingLookups-2021P_V9Slim.xlsm AirComp_lccData_24MAR2020.xlsx | Data and lookups for the lighting analysis Database for the air compressor analysis |