Introduction
The purpose of this paper is to initiate a discussion about future Council forecasting of the demand for electricity. Many of the critical detailed components of the Council’s models are becoming outdated due to reliance on old information about regional energy use. The Council needs to gauge the region’s opinions about the value of its demand forecasting and what level of support is warranted for demand forecasting approaches going forward.
This paper describes the historical context of the Council’s Demand Forecasting System (DFS). That context explains the choice of models and procedures used to develop the Council’s electricity demand forecasts in past power plans. The changing structure of electricity markets has changed the environment in which the Council does its forecasting and planning. As a result it is important to reassess of approach to demand forecasting in light of new requirements and regional needs before substantial sums of money and regional effort are put into developing a new demand forecasting system.
This paper describes the current forecasting system in general terms, explains the various uses of the forecasts within the Council’s planning process and by the wider region, and proposes several alternative approaches to both the upcoming power plan revision and the longer-term demand forecasting role.
Background
Demand forecasts were one of the major issues in the region when the Northwest Electric Power Planning and Conservation Act (the Act) was passed in 1980. At the time, the region had numerous coal-fired and nuclear plants in various stages of planning and construction to meet demands that were expected to grow over 3 percent a year through 2000. Even the 3 percent growth projections were much lower than earlier forecasts, and there was substantial uncertainty in the region about demand growth and the resulting resource requirements as the region outgrew the capabilities of the hydroelectric system. As a result, Section 4(e)(3)(D) of the Act specifically required the Council to do "..a demand forecast of at least twenty years" as part of its power plan.
Another major emphasis of the Act was to treat efficiency gains (conservation) in the same way that generating resources were treated when planning the lowest cost future resource mix. In order to analyze and plan for efficiency resources, it was necessary that the demand forecasts be done in significant end-use detail. Efficiency potential lay in the amount and characteristics of end-use electrical equipment such as space heating systems, washing machines, water heaters, clothes dryers, and other electrical appliances. The demand forecasting system had to be able to forecast the numbers of such appliances as well as their technical efficiency.
Due to the high interest in the demand forecasts, the models were developed with active participation by regional utilities, businesses and interest groups. Three major issues concerned the Council’s Demand Forecasting Advisory Committee. The first was, of course, how fast future electricity demand would grow. The other two concerned the modeling of conservation potential. These concerns became known as "double counting" and "conservation take-back".
With regard to demand growth, the Council realized during the development of the first power plan that it was not reasonable to expect to be able to accurately forecast electricity demand twenty years into the future. Further, reliance on a single incorrect forecast in the past had led to costly mistakes in resource planning. The Council’s plans therefore focused on defining a credible range of alternative demand futures and the factors that might lead to these alternative demand growth rates.
Double counting could have resulted from assessing conservation potential in isolation from the demand forecast so that efficiency improvements estimated to take place in the demand forecast in response to price signals would also show up in the estimated conservation savings potential. Failure to reconcile these two impacts on electricity efficiency could result in under forecasting electricity demand.
Conservation take-back refers to the response of consumers to the reduction in the cost of electricity services as a result of improved efficiency. For example, improved insulation in a home will lower heating bills and could result in raising the thermostat to increase comfort. Thus the savings expected based on technical efficiency changes would overestimate the ultimate reduction in electricity demand.
The need to evaluate conservation savings correctly dictated a particular approach to electricity demand forecasting. The models needed to be able to predict how appliance ownership, utilization, and technical efficiency would change with conservation programs and changing economic conditions. The forecasting system also needed to be able to predict how programmatic changes in efficiency of new equipment or building shells would change electricity demand and how consumers would react to the improved efficiency.
The Demand Forecasting System
These analytical requirements necessitated an extremely detailed approach to demand forecasting. Rather than identifying trends in aggregate or sectoral electricity consumption and their determinants, the Council developed a forecasting system that builds demand forecasts up from the end-use details of each consuming sector (residential, commercial, industrial).
For example, the commercial sector demand forecasting model contains the structure for estimating electricity demand for 10 types of buildings, 8 specific end-uses, 3 fuel types, new and existing buildings, and for customers of publicly-owned utilities and investor-owned utilities separately. This means that there are 960 components to the commercial sector demand forecast. Similarly, the residential sector model identifies 3 house types, 4 fuels, 8 end-uses, utility ownership, and new and existing homes. The industrial model includes 37 different industrial sectors. Some of the most electricity intensive industrial sectors are modeled by individual plants and by end-uses of electricity. The less energy intensive industrial sectors are based on economic relationships among fuel and electricity use and measures of sectoral output and energy prices.
Forecasting with these models requires detailed economic forecasts for all of the sectors that are represented separately in the demand models. The models also require forecasts of demographic trends and fuel prices.
In addition to the sectoral demand models, the demand forecasting system contains an electricity pricing model. The pricing model adds new generating resources as needed to meet electricity demand, and adds up the costs of the existing and new generating resources to estimate total electricity supply costs and electricity prices. Therefore, if predicted demand growth requires substantial new resources and costs, the price of electricity might increase, which would in turn affect electricity demand. The demand forecasting system is iterated until the electricity prices and electricity demands were consistent. The demand forecasts also maintain consistency between the mix of resources in the power plan and the electricity pricing model as well as the amount and timing of conservation program savings.
Before the last power plan update a significant new component was added to the demand forecasting system. As the Western electricity systems became more integrated through deregulated wholesale markets, and as we began to see capacity issues arise in the region, it became clear that we needed to understand the patterns of electricity demand over the seasons, months and hours of the day. Therefore the Load Shape Forecasting System (LSFS) was developed. This model builds up the hourly shape of demand based on the underlying hourly shapes of electricity use by the different types of end-use equipment. It contains about the same detail as the Demand Forecasting System, but when multiplied by 8,760 hours per year, one year’s forecast can contain 400 million values.
The detailed approaches of the DFS and LSFS are expensive and time consuming. Major efforts are involved in collecting detailed end-use data, building the models, and maintaining and operating the systems. The Council hired contractors to build the original Demand Forecasting System. This was done in 1981 through 1983 at a cost of about $500,000. Since then, an additional $200,000 of contract work and large amounts of staff time have been spent to maintain, upgrade, and add to the system. Operating and maintaining the DFS was a challenge for 3 full-time Council staff members. Since completion of the last demand forecast, the Council has only had 2 forecasting staff.
DFS Performance
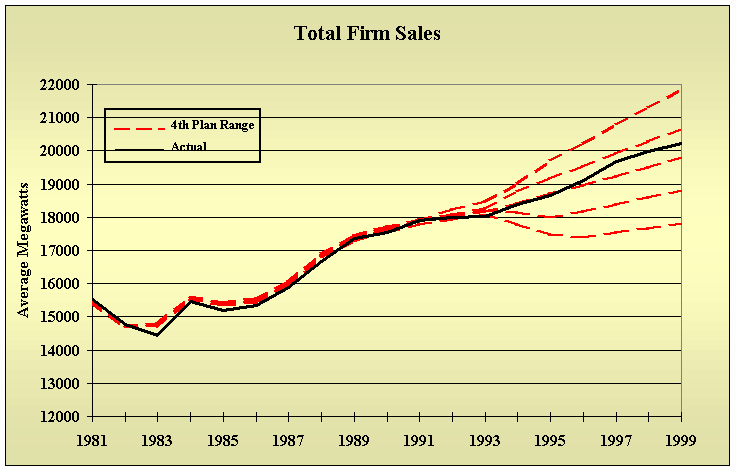
The Demand Forecasting System has performed reasonably well for nearly 20 years. The forecasting models are started in 1981 so the ability to simulate actual demands can be checked for the historical period. The forecasts included in the Fourth Northwest Conservation and Electric Power Plan were completed in September 1995. Therefore, several years of forecasts also can be compared to actual electricity sales. Figure 4 shows both the historical and forecast performance of the Demand Forecasting System. Between 1981 and 1993, when actual values for input assumptions such as economic activity and energy prices are available, the average error of the model’s simulation was 0.4 percent. Between 1994 and 1999, when forecasted input assumptions were used, the average error was 1.0 percent. This error is reduced to 0.7 percent when the forecasts are adjusted for Direct Service Industry policies starting in 1996 to make it consistent with actual sales data.
Figure 4: Forecast and Actual Firm Electricity Sales, 1981-1999
Direct Service Industry sales are not forecast by the models, but are done by assumption for each forecast scenario. Therefore, non-DSI forecasts are a better indication of model performance. Table 1 shows average forecast errors from 1994 through 1998 for non-DSI electricity sales and its major sectoral components. Errors are shown for public and investor-owned utilities separately.
Table 1: Medium Case Average Forecast Errors, 1994-1998
| Total Region | Publicly-Owned | Investor-Owned |
| Average MW | Percent | Percent | Percent |
| Commercial | -22 | - 0.5 | + 5.5 | - 4.5 |
| Residential | +62 | + 0.9 | + 0.4 | + 1.2 |
| Industrial (Non-DSI) | +119 | + 2.5 | + 3.6 | + 1.7 |
| Irrigation | +17 | + 3.6 | - 4.5 | + 12.5 |
| Other | -11 | - 5.5 | - 7.0 | +1.9 |
|
| All Sectors | +165 | + 1.0 | + 2.1 | + 0.1 |
NOTE: A plus sign means that the forecast demand is higher than the actual.
The largest errors during the 1994 to 1998 period are in the irrigation and "other" sectors. These sectors are very small and have little effect on the overall forecast error. The residential, commercial and industrial sector errors are small, but mostly are larger than the aggregate demand errors. The commercial forecasts are too high for publicly owned utilities and too low for investor-owned utilities, but these errors about cancel out in total. Residential forecasts are very good, while industrial demand, excluding direct service industries, tends to be slightly over-forecast.
Clearly, the Demand Forecasting System is still capable of simulating and forecasting electricity demand at these fairly aggregate levels. However, there are simpler forecasting methods that could also perform well at this level. The reason for the use of large detailed end-use models was to generate information about specific end-uses of electricity that could be used to determine potential electricity savings from efficiency improvements. Unfortunately there is little actual data available that can be used to assess whether the forecasting models are performing well at that level of detail. Bonneville collected the detailed end-use data needed to structure the models in the late 1970s and early 1980s. There has been little new information developed since that time.
This has two implications. First, it is not possible to validate the results of the current demand forecast for its detailed end-use components. Second, there is little hope, without a very large data collection effort, of significantly updating the basic underlying data in the current Demand Forecasting System.
Uses of the Demand Forecasts
Before describing alternatives for future demand forecasts, it is important to understand the various roles that demand forecasts and related information play in the Council’s planning and the wider regional energy picture. There are six general roles that the Council’s current demand forecasts play. The alternatives for future forecasting vary in their ability to support these roles.
Determining regional electricity supply requirements: The most basic role of demand forecasts in to gauge the need for new electricity supplies in the future. This is directly required by the Northwest Power Act. The Council’s original DFS forecasts provided energy requirements on an annual basis for investor-owned and publicly owned utilities. With the addition of the LSFS, the demand forecasts address the need for capacity to meet peak loads and the patterns of demand in different seasons, months, and times of day.
Quantifying the uncertainty of future supply requirements: The demand forecasting system is used to explore a range of possible future demand growth and the key factors that could lead to different electricity demand futures. The demand forecast uncertainty contributes one component of future uncertainties that are used to develop more robust, less risky power plans
Assist in assessing conservation savings potential and cost: The demand forecasts provide estimates of electricity using appliances and buildings. The potential savings from efficiency improvements will depend on the stocks of buildings and equipment and their existing energy efficiency. The DFS also estimates how changing prices will affect fuel choices and efficiency levels for these buildings and appliances, and how utilization of energy will respond to changing efficiency levels brought about by conservation programs.
Provide a detailed understanding on electricity use and the causes of its change: Building up demand forecasts in sectoral and end-use detail provides the basis for understanding demand trends. It enables analysts to delve into the likely effects of economic trends, changing industry mix, demographic patterns, and changes in energy markets. It also provides a basis for predicting the importance of changes in energy related technology, such as growing availability and lower prices for front loading clothes washers or compact fluorescent light bulbs.
A benchmark for monitoring regional electricity demand growth: Recently, the region and the Council have had an increased need to track demand growth relative to available resources on a monthly basis. This has been necessary to help understand and manage the current electricity shortage and high prices. This use focuses more on near term demand outlooks and the likely effects of weather on the monthly and hourly electricity needs. The current DFS and LSFS provide some information for this type of assessment, but are really more oriented to long term forecast trends.
A source of information for the region: Many entities in the region have relied on the Council’s demand forecasts, and the economic and fuel price assumptions that drive them, as a source of credible information. This information is used in developing utility integrated resource plans, general education and reporting about energy trends, and corporate planning relative to energy requirements and markets. Although new generation development has largely become the province of non-utility generators responding to market signals, an independent assessment of possible future electricity demands apparently is still valuable. The Council responds to such requests for information almost daily from a wide variety of organizations and individuals.
Alternatives for Future Demand Forecasts
This section lays out some alternatives for demand forecasting for the 5th power plan and for the longer term. The alternatives for the power plan imply different schedules and budgets for the Power Division and produce different quality and detail in the forecasts. The longer term forecasting strategies have different regional data requirements, implications for Council staff and funding, and require different degrees of regional effort.
The first two alternatives are relevant to development of a forecast for the new power plan. The second two alternatives are longer term because they could not be implemented in time to develop the new power plan. They relate to developing new approaches to demand forecasting for future power plans.
Alternative 1: Extend and modify existing forecasts without formal modeling.
This alternative would perform a very simple update to the existing forecast range. Because the current forecast remains reasonably accurate, the changes would not be expected to be large. The demand growth rates could be modified to roughly account for any major changes in assumptions such as economic growth, fuel and electricity prices, etc. and develop new forecasts at the aggregate level needed to drive the resource planning models. End-use and load shape details would be developed by using distributions from the old plan, possibly modified where we have evidence that the old forecasts may be in error.
The advantage is that these forecasts could be developed relatively quickly. The focus of the plan would be on other issues and how they might be sensitive to different demand forecasts scenarios.
This may be the only realistic alternative that could result in revised forecasts within about a year. These forecasts would provide aggregate demand growth rates for the resource planning models and sectoral end-use detail of a comparable composition to the 4th power plan. The forecast results would not be supported by the large amount of detailed analysis that typically goes into a demand forecast. There would not be a detailed economic forecast to share with other regional agencies and businesses.
Summary Effect of Alternative 1 on Fulfilling Forecast Roles| Forecast Roles | Effect of Alternative |
| Determine supply needs | Yes |
| Conservation analysis | Reduced |
| Understand demand changes | Reduced |
| Information for region | Less credible |
Alternative 2: Squeeze another forecast out of the existing Demand Forecasting System.
It might be possible to develop a full-scale forecast using the existing Council Demand Forecasting System. Developing forecasts using the current Demand Forecasting System typically requires about one and a half years. Detailed economic forecasts and other assumptions need to be developed, the models need to be extended to cover 20 years from the present, advisory committees need to be assembled, and models need to be recalibrated to recent demand characteristics and growth.
This approach would provide the same level of detail and information available in the current Council forecasts. There would remain the question, described above, of whether the more detailed end-use information is accurate. The revised economic inputs would provide information for many regional users as it has for the 4th power plan forecast.
Such a forecast would have more credibility than alternative 1, but the time and level of effort required would be substantially larger. Economic forecasts would need to be developed under contract and would probably cost between $50,000 and $100,000. Changes may be required to the Council computer systems to run the old Demand Forecasting System models within the new personal computer based system. The staff time required to implement alternative 2 would be large. The availability of the demand forecasting staff for non-forecasting activities would have to be significantly scaled back to accomplish a new forecast using the existing Demand Forecasting System.
Summary Effect of Alternative 2 on Fulfilling Forecast Roles| Forecast Roles | Effect of Alternative |
| Determine supply needs | Yes |
| Conservation analysis | Yes ? |
| Understand demand changes | Yes ? |
| Information for region | Yes ? |
Alternative 3: Rebuild the current Demand Forecasting System.
One alternative for future power plans would be to rebuild the current demand forecasting system. This would require two major efforts. First, the region would need to collect new data on current uses of electricity and other fuels at the sector and end-use level. Second, new forecasting models, similar to the current Council models, would have to be developed or adapted to operate within the Council’s personal computer based system. These models would need to be populated with region specific information collected in the first step.
Clearly, this approach would result in forecasts that provide all of the details and information provided by the current system. The costs would be very high. Collection of the underlying data on energy use in the region would be an expensive undertaking that should probably be funded on a regional basis rather than just by Bonneville. The cost of collecting such data would probably be over $1 million. Analysis of the data and incorporating into a set of demand forecasting models would be comparable in cost to the data collection. Building an integrated set of sectoral demand forecasting models, electricity price model and a load shape forecasting system with an efficient demand forecasting system would another $1 million. These are very rough cost estimates, but a total of $3 million dollars may be in the ballpark. In addition, use of the resulting forecasting system would require the restoration of the Council economic forecasting position that was been eliminated several years ago or a comparable contracting requirement.
Summary Effect of Alternative 3 on Fulfilling Forecast Roles| Forecast Roles | Effect of Alternative |
| Determine supply needs | Yes |
| Conservation analysis | Yes |
| Understand demand changes | Yes |
| Information for region | Yes |
Alternative 4: Develop a new, less detailed Demand Forecasting System
Another alternative for future demand forecasts would be to develop a new and less detailed forecasting model. Such a model would still be for individual sectors, address changing industrial compositions, and capture the effects of electricity and fuel prices, but would not provide the detailed end-use efficiency information that has characterized past forecasts.
This approach would weaken the consistency between conservation analysis and the demand forecasts. The models could be oriented more to the midterm than the very long term. Such an approach would serve to provide inputs to resource planning models, but would not inform conservation analysis in the same way as past Council analyses. End-use information would have to be allocated based on old demand model results or other information. The forecasts of demand would not automatically adjust for efficiency changes in equipment and building shells. There would be no estimate of behavioral changes in consumption as a result of efficiency changes. We could not run frozen efficiency, price and sales forecasts as we do with the current forecasting system. Forecast ranges could be developed based on some important aggregate input assumptions, but it would be more difficult to explore uncertainties in the end-use details of the forecast.
Development of a less detailed demand forecasting system would not require the extensive data collection that alternative 3 would require. The model could be based on mostly on existing data. The construction of such a model would cost less than $1 million. Staff would have to learn to use the system, but it could probably be operated with existing staff. Such models would require frequent updating, at least for every power plan, because their accuracy may be sensitive to recent data and incorporating that data requires re-estimating the parameters. This might require ongoing contract dollars or increased staff.
Summary Effect of Alternative 4 on Fulfilling Forecast Roles| Forecast Roles | Effect of Alternative |
| Determine supply needs | Yes |
| Conservation analysis | No |
| Understand demand changes | Limited |
| Information for region | Reduced |
We need your advice and suggestions
The Council needs your advice and suggestions on the important purposes of the demand forecasts and the alternatives presented above. Obviously, the alternatives are not limited to the exact ones described above. In addition, there may be opportunities for collaboration among the region’s utilities and other organizations in collecting needed information on demand and in using that information to develop a new generation of demand forecasting models. To help structure your response several questions are proposed below. Your responses, however, need not be limited to these proposed questions.
- Which of the six roles of the demand forecasts and their underlying assumptions identified above are most important? Which roles are no longer important in today’s electricity market structure? Are there other roles that were not identified above that should be considered?
- How important is the detailed end-use approach to demand forecasting for conservation analysis? Is this level of detail worth the expense of collecting the necessary data and rebuilding the demand forecasting models?
- If you find the detailed modeling approach important, how might the region collaborate to develop the necessary data and models?
- Should the Council devote more effort to understanding and predicting the shape of demand over seasons, months and hour of the year?
- Should the forecasts place a greater emphasis on the short term (3 to 5 years) than on the long term?
The Council requests your advice and suggestions by July 6, 2001. Email to comments@nwcouncil.org and reference document 2001-13, or send to the Council office.


