The wholesale price of electricity is a key driver in resource decision making and captures the dynamics of supply of and demand for electricity throughout the Western power grid (WECC[1] footprint). To forecast wholesale power prices at the Mid-Columbia trading hub into the future the Council uses a model, AURORA[2], that can both estimate the buildout of future resources throughout the western grid via capital expansion modeling and generate wholesale power prices via production cost modeling.
For the 2021 Power Plan, the Council’s production cost simulations in AURORA are primarily focused on capturing the effects on market prices and avoided CO2e emissions rates[3] due to the changing policy landscapes. These effects are explored via scenario work where different policy outcomes are tested over different hydro runoff conditions, which continue to be a major component of annual and seasonal price variability in the Pacific Northwest due to the regional reliance on hydropower generation.
Like for the WECC-wide buildout setup, there were many modifications to the default AURORA configuration of the production cost modeling and revised input assumptions for this power plan. These changes are catalogued in the subsections described below, and the timeline of the changes is covered in more detail on the System Analysis Advisory Committee webpage.
These changes are catalogued in detail in the following material:
Outputs from Classic GENESYS, Inputs to AURORA
Integrating Climate Change Data and Policies
Integrating Generating Resources Data
Integrating Energy Efficiency Data
Integrating Demand Response Data
The timeline of the presentation of and changes to assumptions and modeling techniques is covered in more detail on the System Analysis Advisory Committee webpage.
Production Cost Simulation Results
The wholesale power prices at the Mid-Columbia hub are reported as a proxy for regional pricing for the purposes of the 2021 Power Plan. Those Mid-Columbia (Mid-C) prices are determined endogenously in AURORA by determining the average of marginal price of electricity at the Grant County, Chelan County and Douglas County Public Utility District zones.[4] This modeling was performed for the following simulations and is used to support the scenario work in the plan: Baseline Conditions, Early Coal Retirement, WECC-Wide Emissions Price, No Gas Build Limitations, Limited Markets and Organized Markets.
For the baseline conditions studies the prices were simulated on an hourly basis for every day in each year from 2021 through 2041. For all the other production cost simulations supporting scenario work, the prices were simulated on an hourly basis for one sample day per month[5].
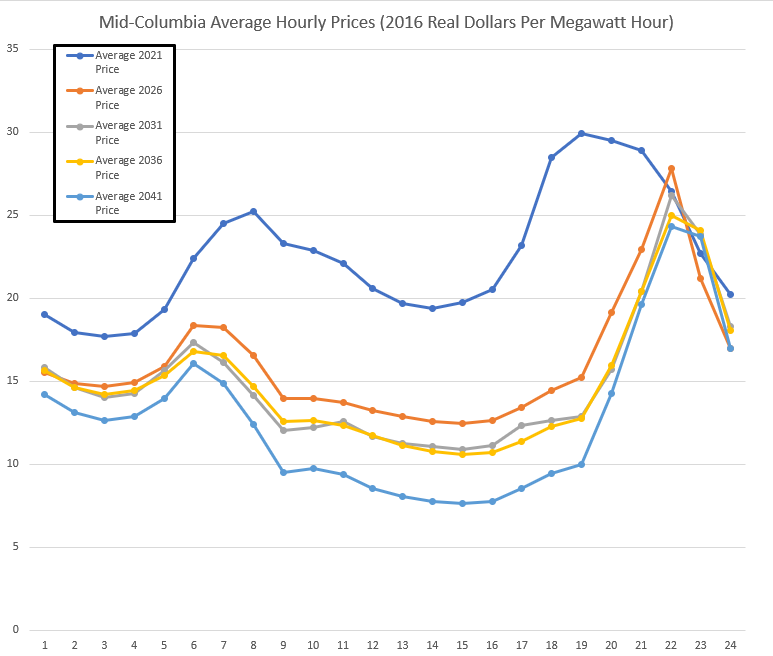
Daily Price Shape from the Baseline results

A result consistent in many of scenarios was a change in the shape of daily prices due to the buildout of solar generation. The significant increase in low variable cost generation in the middle of the day caused a significant dip in the midday prices in all seasons to previous forecasts. Prices do tend to stay higher in the evening and morning hours. The graph above shows not just the drop in midday pricing but also the annual decrease in prices in all hours.
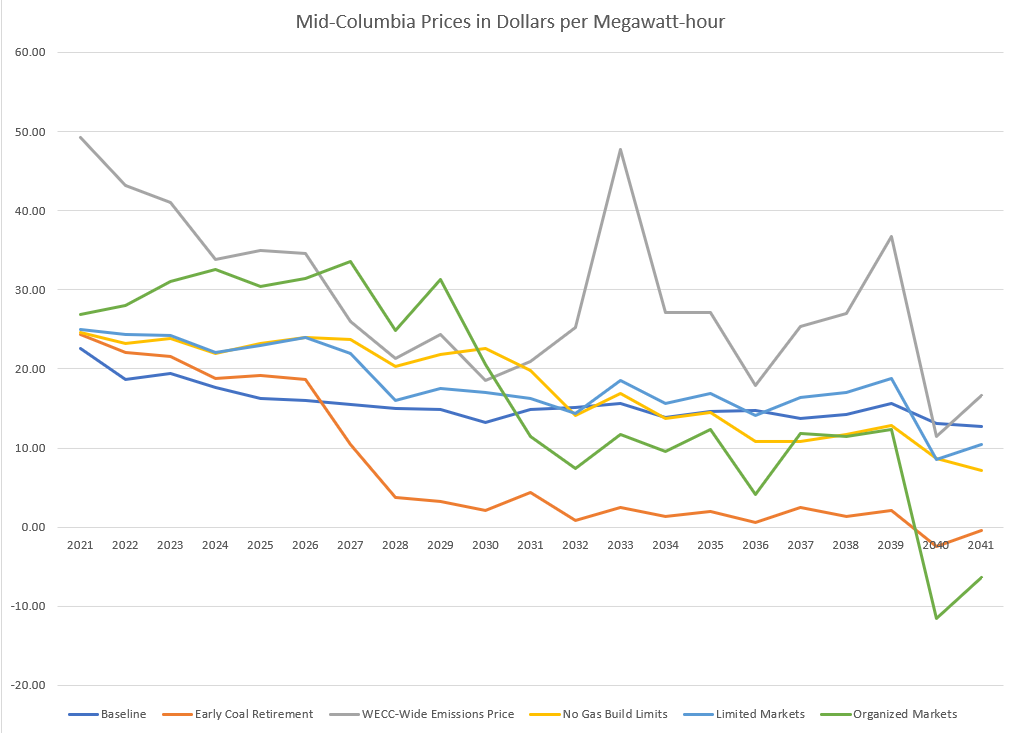
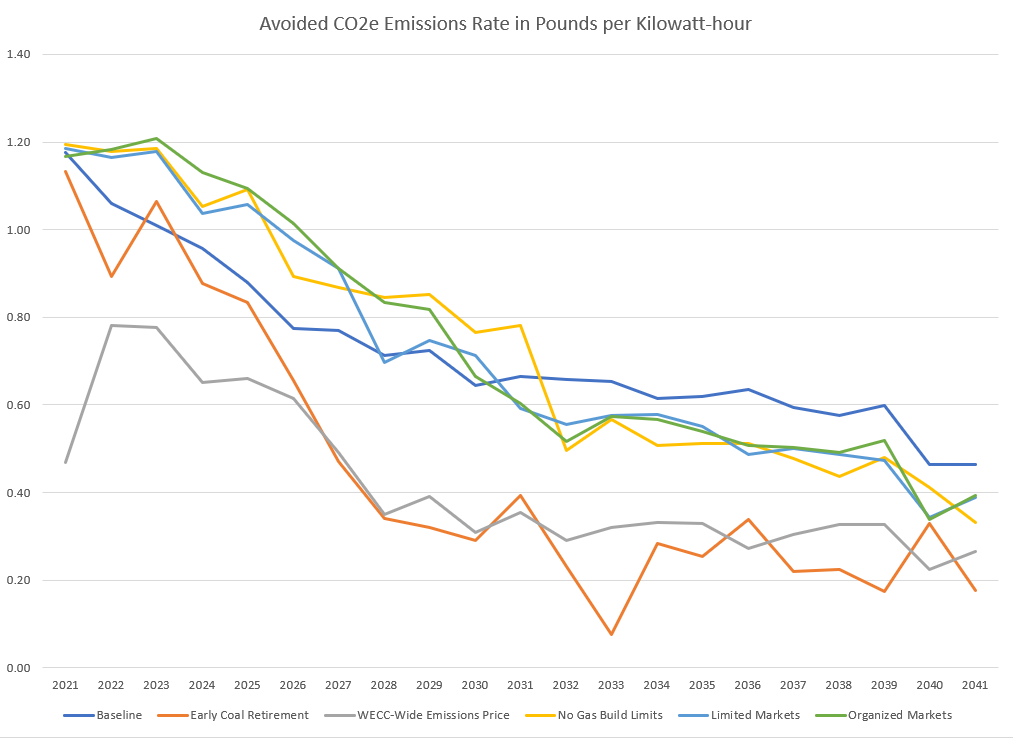
In general, the annual average power prices drop from year to year in every scenario, as do the annual average avoided emissions rates as seen in the graphs below. The prices drop at different rates mostly depending on the speed of the WECC-wide renewable buildout. Here are a couple examples of that phenomenon.
- Annual prices decrease earlier in the early coal retirement scenario, corresponding to more early renewable builds backfilling for the early coal retirements.
- Slower price drop in the organized markets scenario due to the more efficient use of renewables[6] WECC-wide, deferring builds until 2030 and early 2040s when policies create a jump in the number of clean resources required.
Additionally, prices remain higher in general when there is an explicit WECC-wide emissions price and it is more susceptible to year-to-year price differences depending on retirements of plants and load growth.
Mid-C Prices – All scenarios

Avoided Emissions Rate – all scenarios

The avoided emissions rates forecast is an estimation of the marginal CO2e[7] production rate for the region for each hour of the simulation period from 2021 through 2041. The average emissions rate for the Northwest region has always tended to be significantly lower than the avoided emissions rate due to a majority of the load in many of the hours of the year being served by Northwest hydropower. As renewable generation increases throughout the west due to the combination of policies and load growth, the efficient baseload gas and coal generators that have traditionally been proxies for the marginal emissions rate are economically decommitted. This means that hydro or renewable generators are on the margin for more hours of the year. This drives down not just average prices and emissions, but also the emissions one could expect to be associated with an additional market purchase[8] to serve some small increment of additional load.
The Council staff and the System Analysis Advisory Committee utilized the following methodology to approximate the “marginal” CO2 production rate for the region. The method is as follows:
- Run two AURORA simulations, one as a base case and one with a reduction of 1000 megawatts[9] over all hours of the year.
- Calculate the ratio WECC-wide change in emissions and change in power generated between the two simulations.
The ratio described is a modification of the method used in a recent avoided market emissions rate study.
For each of the simulations sets there are prices and avoided emissions rates calculated from the AURORA output. The files and analysis are linked in the material below.
Baseline
The baseline conditions price simulations are used to support the baseline conditions price forecast in the regional strategy. The baseline pricing is based on the same set of assumptions utilized by the baseline conditions buildout.
The following spreadsheets contains further supporting information on the baseline conditions market prices and avoided emissions rates:
Baseline Market Price Analysis
Baseline Prices - High, Medium and Low Gas
Baseline Avoided CO2e Emissions Rates
Early Coal Retirement
The price simulations used to support the Early Coal Retirement scenario price forecast in the regional strategy is based on the same set of assumptions and configuration utilized by the Early Coal Retirement scenario buildout.
The following spreadsheets contains further supporting information on the early coal retirement scenario market prices and avoided emissions rates:
Early Coal Retirement Market Price Analysis
Early Coal Retirement Avoided CO2e Emissions Rates
WECC-wide Emissions Pricing
The price simulations used to support the WECC-wide emissions pricing scenario price forecast in the regional strategy is based on the same set of assumptions and configuration utilized by the WECC-wide emissions pricing scenario buildout.
The following spreadsheets contains further supporting information on the WECC-wide emissions pricing scenario market prices and avoided emissions rates:
WECC-wide emissions pricing Market Price Analysis
WECC-wide emissions pricing Avoided CO2e Emissions Rates
No Gas Build Limitations
The price simulations used to support the no gas build limitations scenario price forecast in the regional strategy is based on the same set of assumptions and configuration utilized by the no gas build limitations scenario buildout.
The following spreadsheets contains further supporting information on the WECC-wide emissions pricing scenario market prices and avoided emissions rates:
No gas build limitations Market Price Analysis
No gas build limitations Avoided CO2e Emissions Rates
Limited Markets
The price simulations used to support the limited markets scenario price forecast in the regional strategy is based on the same set of assumptions and configuration utilized by the limited markets scenario buildout.
The following spreadsheets contains further supporting information on the limited markets scenario market prices and avoided emissions rates:
Limited markets Market Price Analysis
Limited markets Avoided CO2e Emissions Rates
Organized Markets
The price simulations used to support the organized markets scenario price forecast in the regional strategy is based on the same set of assumptions and configuration utilized by the organized markets scenario buildout.
The following spreadsheets contains further supporting information on the organized markets scenario market prices and avoided emissions rates:
Organized markets Market Price Analysis
Organized markets Avoided CO2e Emissions Rates
[1] WECC stands for Western Electric Coordinating Council which is the not for profit corporation that exists to ensure a reliable bulk power system throughout the Western Interconnection, which includes the following: British Columbia, Alberta, Washington, Oregon, Idaho, Wyoming, California, Nevada, Utah, Arizona; most of New Mexico, Montana, Colorado; and some of the Dakotas, Nebraska and North Baja California.
[2] AURORA is a commercial production cost model licensed from Energy Exemplar
[3] CO2e refers to carbon dioxide equivalent emissions
[4] Zones are a representation of a collection of balancing authority loads and resources in AURORA
[5] The only price fidelity needed for the Regional Portfolio Model is an expected daily shape by month or quarter to capture seasonality. The computational and time burden to run every hour as in the Baseline conditions was judged to not be worth the additional accuracy in the price forecast.
[6] More efficient use of renewables results in less curtailment, which means less resources can be used to meet the same requirements.
[7] CO2e is short for carbon dioxide equivalent, a sum of the emissions from a number of compounds of which only a few of the emissions rates are available for all resources. For the purposes of the studies referred to above, CO2e shall refer to the equivalent sum of the carbon dioxide, methane and nitrogen dioxide emissions.
[8] Marginal emissions rate that is approximated in the plan analysis by an avoided emissions rate.
[9] This 1,000 megawatt reduction was applied proportionally to all the zonal loads within the region. So if a zone represented 50% of the load of the region it would have a 500 megawatt reduction over all hours in that particular simulation.


